Bigger Subsidies Make Bigger Solar a Bad Bet

Date: 18 Nov 2011 | posted in: Energy, Energy Self Reliant States | 0 Facebooktwitterredditmail

Americans seem unable to resist big things, and solar power plants are no exception. There may be no reasoning with an affinity for all things “super sized,” but the economics of large scale solar projects (and the unwelcome public scrutiny) should bury the notion that bigger is better for solar. In fact, smaller scale solar and … Read More

Community Wind Act: More Locally Owned Wind Power

Date: 10 Nov 2011 | posted in: Energy, Energy Self Reliant States | 0 Facebooktwitterredditmail

Wind TurbineThe use of the tax code has long made the federal wind power incentives something of a bane for community wind power.  Finding strategies to use the passive-income-only Production Tax Credit has made community wind developers do legal acrobatics to structure deals with tax equity partners that can use the credits.

Senators Al Franken (D-MN) and Jon Tester (D-MT) hope to make community wind easier with the Community Wind Act.

The bill, introduced in late October 2011, would extend an existing 30% investment tax credit (ITC) for very small wind (100 kilowatts and smaller) to wind projects up to 20 megawatts in size.  Since the ITC doesn’t require passive income, it may be easier for community wind developers to use the credit internally or to find tax equity partners closer to home. 

Brian Minish, whose company Val-Add Services helped develop the innovative South Dakota Wind Partners community wind project, believes that the Community Wind Act could make a big difference: 

We strongly support the Franken-Tester Community wind bill so other groups like ours have the opportunity to build competitive wind farm projects.  Not needing to have investors with passive income to be able to utilize the production tax credits to take advantage of the federal incentive helped our project be successful.

The Wind Partners project brought together over 600 local farmers and South Dakota residents to own seven utility-scale wind turbines in a 10.5 megawatt wind project and utilized the short-lived cash grant in lieu of the Production Tax Credit.  With the Community Wind Act, Wind Partners could more easily be replicated.

Click here for the full bill (pdf) or a 1-page summary from Sen. Franken’s office.  Click here to track S. 1741 on Govtrack.

Read More

The 21st Century Electric Grid: Matching Production and Consumption

Date: 8 Nov 2011 | posted in: Energy, Energy Self Reliant States | 0 Facebooktwitterredditmail

In the 20th century electric grid, adding a variable source of power generation like wind or solar upset the paradigm: big coal and nuclear plants run constantly, efficient natural gas plants meet intermediate demand, and fast gas, hydro or diesel peakers fill the peaks. But the 21st century grid is different and the best strategy for … Read More

Nuance on Krugman’s “Solar is now cost-effective”

Date: 7 Nov 2011 | posted in: Energy, Energy Self Reliant States | 0 Facebooktwitterredditmail

Nobel economist Paul Krugman made waves today when his column “Here Comes the Sun” noted that the rapidly falling cost of solar electricity – “prices adjusted for inflation falling around 7 percent a year” – meant that “solar is now cost-effective.”

It’s close. But it depends on what’s meant by “cost-effective.”

The first step is translating solar prices into electricity prices.  Installed costs for solar have dropped dramatically, from $8 to $10 per Watt just a few years ago to as low as $3.50 per Watt for utility-scale systems as just over $4 per Watt for residential systems.  But electricity isn’t sold in Watts, but in kilowatt-hours (kWh).  So, solar installed at $3.50 per Watt in Minneapolis, MN, will produce electricity for about 23 cents per kWh.  In sunny Los Angeles, the same solar PV array would produce power at 19 cents per kWh, because the more abundant and direct sunshine would make 20% more solar electricity over the same time period.

In either place, such prices don’t compare favorably to average residential retail electricity prices of 8 and 12 cents, respectively.  In fact, none of the top 40 metropolitan areas in the country have average prices for electricity as high as 19 cents.

But there are several caveats:

  1. Grid electricity prices are not fixed, but changing.  Over the past decade, electricity prices have risen, on average across the United States, 3 percent per year.  The solar electricity price is locked in once the panels are operating.
  2. Some utilities have time-of-use rates that charge more for electricity during peak times (hot, summer afternoons) that rise as high as 30 cents per kWh.  Solar competes favorably against these rates.
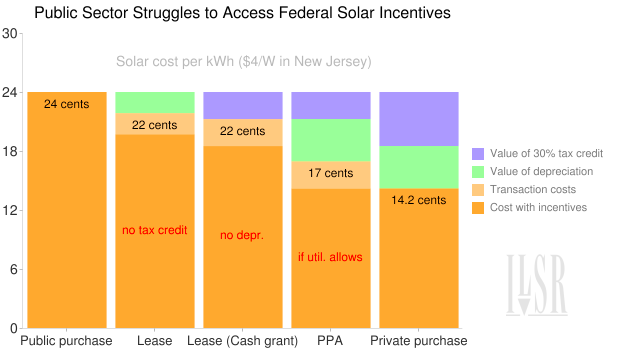
  3. There are federal, state and utility incentives for solar that reduce the cost.  The 30% federal tax credit, for example, is in statute until the end of 2016.

How much do these issues matter? 

Electricity Price Inflation Makes Solar Competitive Now

If electricity price inflation continues apace, by the time their solar PV systems are halfway to their expected life of 25 years, 45 million Americans (roughly 1 in 6) would have cheaper electricity from solar if they installed right now at $3.50 per Watt.

Time-of-Use Pricing Makes Solar Competitive Now

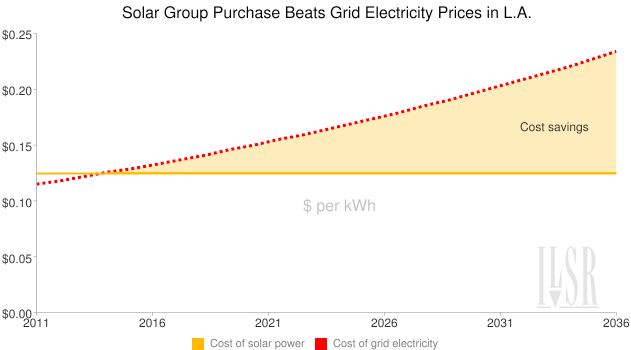
Time-of-use pricing lets utilities charge different prices for electricity at different times of day, based on the actual cost of delivering power at those times.  In many places, the higher prices coincide with hot, sunny summer afternoons and effectively increase the cost of electricity by 30% during the time a solar panel produces power.  Already 22 million Americans in Southern California can install solar at $3.50 per Watt and beat time-of-use pricing for grid electricity.

Incentives for Solar Accelerate Cost-Effectiveness

Solar power is crossing a cost-effectiveness threshold against grid prices that are rising and reflect the true cost of electricity.  But incentives that capture the environmental and economic benefits of solar help finance projects outside of the sunny Southwest.

While only 3 million Americans can beat grid prices with $3.50 per Watt solar and no incentives, 41 million Americans can beat grid prices using the 30% federal tax credit.  And the market expansion enabled by tax incentives is driving down the cost to install solar (labor and materials) as well as the cost of modules.

Time Makes Solar a Winner

As Krugman notes, the falling costs of solar make time its greatest ally.  The following chart illustrates the number of Americans in the top 40 metropolitan areas for whom solar (at $3.50 per Watt in 2011) beats grid electricity prices (average residential retail rates) over the next 10 years.  The base assumptions are that the price of solar declines by 7% per year and grid electricity prices rise by 3% per year.  The chart examines solar with no incentives and with the 30% tax credit, and with and without utility time-of-use pricing (expected to boost the retail rate during solar producing hours by 30%).  The no incentive and tax credit lines merge after the 2016 expiration of the 30% tax credit.


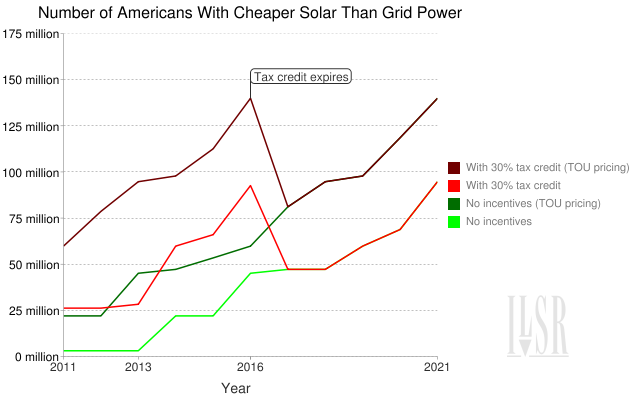
Even without the federal tax incentives or favorable time-of-use pricing, nearly 50 million Americans can beat their utility’s electricity price with solar by 2016.  With time-of-use prices, it’s over 90 million by 2016.  And with the tax credit factored in, it’s nearly half the country.  Of course, the chart will tend to underestimate over time, as the greatest population growth tends to be in the largest metropolitan areas (with the highest electricity prices).

Here comes the sun, indeed.

Read More

Commercial PACE Surges Ahead With Financing for Efficiency and Local Renewables

Date: 4 Nov 2011 | posted in: Energy, Energy Self Reliant States | 0 Facebooktwitterredditmail

Energy efficient roofing materials installed at a building at NNSA's Pantex PlantProperty-assessed clean energy (PACE) financing launched three years ago with great promise.  The premise was simple: pay for building energy efficiency and on-site renewable energy with long-term property tax assessments, aligning payback periods and financing terms.  The residential program’s rapid expansion came to a screeching halt in mid-2010 when the Federal Housing Finance Agency told lenders that Fannie Mae and Freddie Mac would not buy mortgages with PACE assessments on them.

Commercial PACE was left alive, and programs for business and industry are finally getting scale. 

In September, the Carbon War Room announced a business consortium would provide $650 million in financing for commercial energy efficiency and renewable energy improvements for two regions: Sacramento, CA, and Miami, FL.  San Francisco announced a similar program in October, with $100 million in private funding.  For comparison, the largest operational PACE program to date in Sonoma County, CA, has completed $50 million in retrofits. 

An interesting difference in the new programs is that they inject private capital into PACE programs that were often envisioned as publicly financed (e.g. using municipal revenue bonds).  It’s a welcome development, however, since public sector programs had grown slowly – if at all – since the FHFA decision to curtail residential financing.

The opportunity in commercial PACE alone is enormous.  The Pacific Northwest National Laboratory estimates that building energy consumption could be cut by 15-20% in the United States with the right technologies and tools. Since buildings represent 40% of energy use, beefed up commercial PACE activity could be a big step in the right direction.

For more on the residential program and attempts to revive it, visit PACENOW.org.

Read More

Public Solar Often a No-Go With Fed’s Favor for Solar Tax Incentives

Date: 3 Nov 2011 | posted in: Energy, Energy Self Reliant States | 3 Facebooktwitterredditmail

You’re a city manager hoping to cut electricity costs at sewage treatment plant, a school administrator looking to power schools with solar, or a state park official needing an off-grid solar array for a remote ranger station. 

But unlike any private home or business, you can’t get 50% off using the federal tax incentives for solar (a 30% tax credit and ~20% from accelerated depreciation).  That’s because the federal government’s energy policies all use the tax code, and your organization is tax exempt.

What about a public-private partnership?  The private entity puts up some money and gets the tax benefits, and the public entity only has to pay half.  It can work, if you’re lucky, although a good portion of those tax benefits (half, in recent years) pass through to that private entity for their return on investment, not changing the price of your solar array.

But the legal niceties also matter.  One common option is a lease, where the public entity leases the solar panels from the private one.  One big problem: the IRS doesn’t allow the private entity to collect the 30% tax credit if they lease to a public entity. 

The cash grant program in lieu of the tax credit allowed leasing, but it expires in December.  Furthermore, it disallowed depreciation of the solar array, equivalent to 20% off.

Another clever arrangement is a power purchase agreement (PPA), where the third-party owns the solar array and simply sells the power to the school or city.  The third-party can claim both the tax credit and depreciation, but if you live in a state with a regulated utility market (and no retail competition), your utility might slap you with a lawsuit for violating their right to exclusive retail service.

The following chart illustrates the financial challenge for public entities created by using the tax code to support solar. 

Chart of public sector options for solar purchase and federal incentives lost

Even with a lot of legal creativity, the public sector is often stymied in accessing both federal solar incentives.  The result is that private sector solar projects always get a lower cost of solar, because the public sector can only access federal incentives through (costly) partnerships with third parties.

Using the tax code for solar (instead of cash grants, production-based incentives, or CLEAN Contracts) is bad for the solar business, bad for taxpayers and bad for ratepayers.  It’s time to change course, and let the public sector go solar, too.

Read More

Citizens give “going Boulder” a new meaning: local energy self-reliance

Date: 2 Nov 2011 | posted in: Energy, Energy Self Reliant States | 5 Facebooktwitterredditmail

By a razor-thin margin, Boulder citizens gave the city a victory for energy self-reliance on Tuesday, approving two ballot measures to let the city form a municipal utility.  If the city moves ahead, it would capture nearly $100 million currently spent on electricity imports and instead create up to $350 million in local economic development by dramatically increasing local clean energy production.   

The stage was set over several years, as the city’s multiple pleas for more clean energy were given short shrift by the incumbent electric utility, Xcel Energy.  Instead of meeting local demands for more wind and solar power, Xcel instead financed a new coal power plant and told Boulder that it could have more wind power only if it paid extra, and paid when the wind didn’t blow.  In response, the city authorized two measures for the Nov. 1 ballot to allow the city to pursue municipal clean energy production.

The campaign was enormously lopsided.  Xcel dumped nearly $1 million into a vote ‘no’ campaign,  outspending local clean energy supporters by a 10-to-1 margin and spending nearly $77 for each no vote.  On the flip side, nearly every local business or newspaper endorsement (and nearly 1000 individual citizen endorsements) supported a ‘yes’ vote.  Despite the financial disadvantage, the local grassroots groups won, though their margin of victory was less than 3%.

The victory margin was small, but the clean energy and economic opportunity is enormous.  According to a citizen-led and peer reviewed study, the city could increase renewable energy production by 40 percent from multiple, local sources without increasing rates.  In contrast to the $100 million in revenue sent to Xcel under the current arrangement, the economic value of local energy production and ownership could multiply within the city’s economy to as much as $350 million a year, according to research by the National Renewable Energy Laboratory.   

If the city uses its new authority to become a utility, future generations may look back at 11/1/11 as the shot heard round the world – a shot fired for clean, local energy – and ask why more Americans didn’t “go Boulder” sooner. 

Read More

Group Purchase Gets Residential Solar to Grid Parity in Los Angeles

Date: 26 Oct 2011 | posted in: Energy, Energy Self Reliant States | 3 Facebooktwitterredditmail

Back for a second round, the Open Neighborhoods organization in Los Angeles has organized another group purchase of residential and commercial solar PV, bringing the cost of solar incredibly close to the cost of grid power. With grid prices constantly rising, the lifetime savings of going solar have never looked better.

The savings from the group purchase are enormous.  With prices are around $4.40 per Watt installed for solar, Open Neighborhoods gets residential solar for $2.00 cheaper than the average prices reported by the Solar Energy Industries Association for the second quarter of 2011.  That equates to a 6 cents per kilowatt-hour savings on solar over 25 years.  Even with solar typically being cheaper in California, the group advertises savings of as much as 33% on a residential solar array.

The low group purchase price means that those who go solar will have cheaper electricity from their rooftop panels than average grid electricity by 2015.  If the solar user is on a time-of-use pricing plan, they’ll already have cheaper electricity from solar than from their utility.

The following chart illustrates the comparison between the cost of power from a rooftop solar array purchased as part of this group buy versus grid electricity at a flat rate.


The results are promising and show that economies of scale can be achieved even with residential solar, if folks work together.

Read More

1 52 53 54 55 56 57 58 115