Solar PV Has an Speed Edge on Concentrating Solar Thermal

Date: 14 Jun 2011 | posted in: Energy | 0 Facebooktwitterredditmail

CSP represents over 6,000 MW of the over 15,000 MW of future solar projects that SEPA is tracking, but there are differences in project development between CSP and PV. PV can be built and sub-sections of the larger project can be energized over time, resulting in lower construction risk and balance-sheet impact. CSP projects need to be completed in full before commissioning, a period which takes several years from start to finish. [emphasis added]

Read More

Solar Diseconomies of Scale

Date: 14 Jun 2011 | posted in: Energy | 0 Facebooktwitterredditmail

PV projects, which ranged in size from 1-kilowatt residential installations to 48-megawatt power plants, have much shorter planning horizons and project completion times, along with lesser siting, permitting, financing and transmission requirements at these small- and medium-sized scales.

However, larger PV and CSP projects (those greater than 50 MW) require overcoming financing, siting/permitting, and transmission barriers that might emerge at these larger sizes. [emphasis added]

Read More

Solar Economies of Scale (Update)

Date: 14 Jun 2011 | posted in: Energy, Energy Self Reliant States | 2 Facebooktwitterredditmail

In drafts of ILSR’s forthcoming report on a distributed generation future (check back June 22!), I took some flak for my solar PV economies of scale analysis.  In it, I used data from the California Solar Initiative (through 2009) to point out that most economies of scale in solar PV seem to be captured at a size of 10 kilowatts (a large residential-scale project). 

“The solar statements seem way off base,” wrote one reviewer. 

Upon further review, I stand by my initial claim.  But, I note that the critics have a point, as well.

For deeper analysis, I grabbed data from Lawrence Berkeley Labs’ 2010 report Tracking the Sun III, which provided a very nice breakdown of installed costs for solar PV by project size.  I then dropped those size ranges into the California Solar Initiative (CSI) data for the whole data set (2006-2011) as well as for just the past two years (2010 to present).  The following chart illustrates the findings:

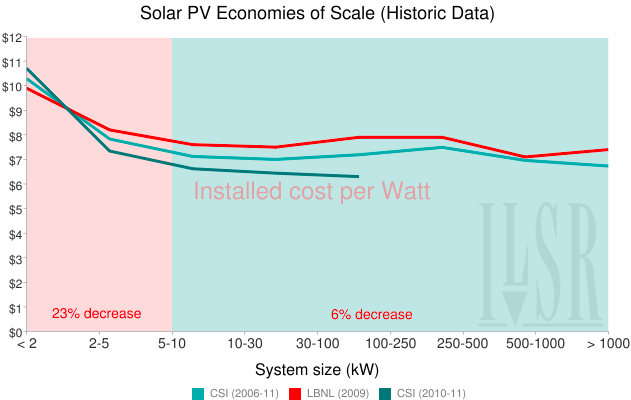
The historic data confirms my earlier analysis, that most economies of scale are achieved at small size.  In the full CSI database, there’s a 23% decrease in per Watt cost when increasing project size from under 2 kW to 5-10 kW, but only a further 6% percentage point decrease in sizing up to over 1,000 kW.  The other two curves are quite similar.

But the historic U.S. data is not the only story. 

The Clean Coalition – a distributed generation advocacy organization – has different numbers on installed cost from their network of installer partners.  These figures, data on very recent or proposed installations, tell a different tale, illustrated below:

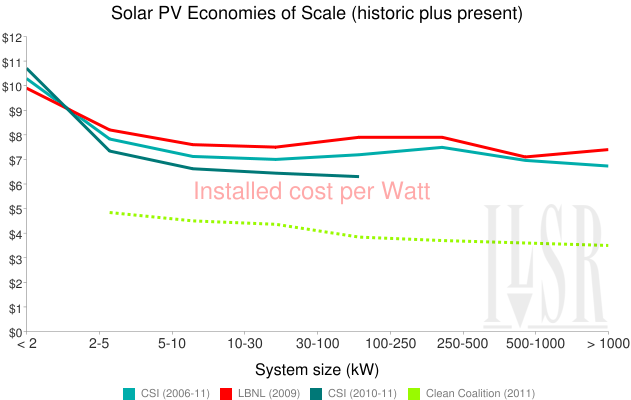
In the Clean Coalition data, the savings from 5 kW to 25 kW are about 10%, but the savings from upsizing to 100 kW are a cumulative 21%, and growing to 1,000 kW offers a total of 28% off the 5 kW price per Watt. In other words, economies of scale continue strongly through the 100 kW size range.

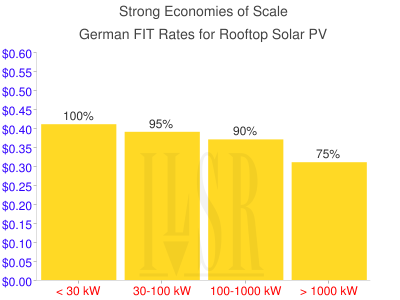
Their data is not alone.  In the German feed-in tariff, solar PV producers are paid a fixed price per kWh generated, with prices set according to the location of the solar PV plant (roof/ground) and by size (small, medium, large, etc).  Overall, Germany is simply cheaper, with average installed costs for 10-100 kW rooftop PV installations of just $3.70 per Watt.  But their economies of scale are also strong: there is a 10% price differential between rooftop solar arrays smaller than 30 kW and those  100-1000 kW, but an additional 15% price drop for projects over 1000 kW. 

The conclusion is murky.  Historical data in the U.S. supports my original assertion: economies of scale for solar PV are limited beyond 10 kW.  But recent installed cost data and the German experience both suggest that there are stronger economies of scale up to projects 1,000 kW (1 MW) in size.

Read More

Land Use Not a Barrier for Distributed Renewable Energy

Date: 9 Jun 2011 | posted in: Energy, Energy Self Reliant States | 0 Facebooktwitterredditmail

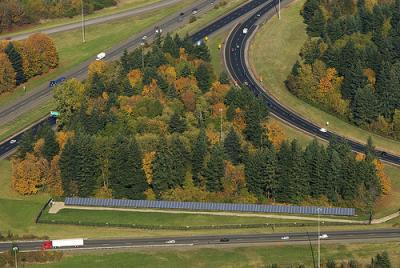
A column in the New York Times yesterday suggested that land use is the greatest environmental problem facing new renewable energy.  While getting the facts terribly wrong, it opens a door to talk about the advantages of distributed generation such as a unique proposal by Republic Solar Highways to put solar PV on highway right-of-way in California.

Robert Bryce’s column (the Gas is Greener) suggests that wind and solar have a large land footprint compared to gas and nuclear power, and therefore the latter are wiser environmental choices.  Of course, Bryce hasn’t read about the Germans, who have installed 10,000 megawatts of solar PV in the past two years, over 80 percent on rooftops.  Bryce’s concern for California meeting its 33% renewable energy standard by 2020 (the land use!) crumbles under the German’s torrid pace of rooftop solar development: if the same distributed solar PV program were done in California, the state could meet its RPS five years early without using a single acre of undeveloped land.

Bryce deserves a raspberry for his witless comment about wind farms, as well.  Before claiming that wind uses 128 acres per megawatts, he may have wanted to look at an actual wind power project.  Over 99 percent of a wind farm is simply the gaps between turbines to prevent interference (“wake turbulence”).  In fact, 80 percent of U.S. wind farms use less than an acre per megawatt, one reason that many farmers and ranchers are delighted to host revenue-generating turbines.

Despite its factual foibles, Bryce’s column underscores the fundamental problem with the renewable energy movement.  Too many people assume that wind can only be developed in 800 megawatt farms and solar power plants can only be built on hundreds of virgin desert, both linked into high-voltage transmission lines.  The Germans put the lie to this assumption with their solar program and wind power development.  And innovations in the U.S. also provide compelling counter-examples.

Republic Solar Highways, for example, has proposed a 15 megawatt solar PV project along the right-of-way on U.S. Highway 101 in California.  The plan would provide power for 3,000 homes and use land that currently gets an occasional mowing from the Department of Transportation, but is otherwise unused.  The idea has a lot of merit, as we explored in our 2010 report Energy Self-Reliant States:

On either side of 4 million miles of roads, the U.S. has approximately 60 million acres (90,000 square miles) of right of way. If 10 percent the right of way could be used, over 2 million MW of roadside solar PV could provide close to 100 percent of the electricity consumption in the country. In California, solar PV on a quarter of the 230,000 acres of right of way could supply 27% of state consumption.

There are environmental drawbacks to some centralized solar and wind projects and their attendant new transmission lines, but Bryce vastly overstates their land use requirements, and glosses over the additional land natural gas and nuclear grind up for mining and extraction.  Cost-effective distributed wind and solar power can be built in large numbers without using much undeveloped land, obviating the land use complaint.  


P.S. And distributed wind and solar don’t melt down, either.

Photo credit: Flickr user OregonDOT

Read More

FERC’s High-voltage Gravy Train Rolls On

Date: 7 Jun 2011 | posted in: Energy, Energy Self Reliant States | 0 Facebooktwitterredditmail

Mid-May proved beneficial for many high-voltage transmisison developers, as the Federal Energy Regulatory Commission’s “high-voltage gravy train” kept delivering the cash.  Five additional transmission projects received incentives, including bonsues to the project’s return on equity or rate recovery during construction. Earlier this year, I wrote about FERC’s program of incentives for new transmission projects, noting two … Read More

Solving Wind’s Variability with More (Dispersed) Wind

Date: 3 Jun 2011 | posted in: Energy, Energy Self Reliant States | 3 Facebooktwitterredditmail

The solution to the variability of wind power is more wind.

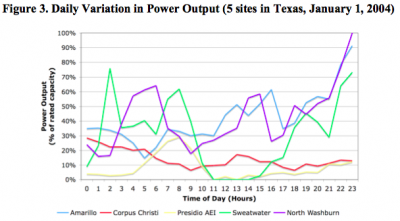
The output from a single wind turbine can vary widely over a short period of time, as wind goes from gusty to calm.  The adjacent graphic (from this report) illustrates how a single turbine in Texas provided varying power output over a single day, varying from under 20 percent of capacity to near 100 percent!

But the same report also illustrated the smoothing effect when the output from these five wind sites was averaged.  The following chart shows (in dark orange), the smoothing effect of output when the wind output was averaged over five sites.

The impact is significant, and the optimized system varies from 15 to 50 percent of capacity, compared to individual turbine variability that’s twice as large.  Over a longer period (a year), the optimized (combined) system provides significantly more reliable power to the electric grid.  It reduces periods of zero output to a few hours per year, effectively zero probability.

Combining the output of the five sites also increases the probability that the output will be at least 5% or 10% of total capacity of the wind turbines.

Other studies have reinforced these findings.  For example, a report by Cristina Archer and Mark Jacobson in 2007 found that dispersing wind at 19 sites over an area the size of Texas increased the level of guaranteed output by 4 times. 

Wind power could not be the sole source of electricity for the grid without massive overbuilding of capacity, but its variability is an argument for more dispersed wind, rather than less of it.

Read More

Learning a Lesson about Net Metering

Date: 1 Jun 2011 | posted in: Energy, Energy Self Reliant States | 7 Facebooktwitterredditmail

I just got a copy of a utility bill for a Minnesota business that has a 40 kilowatt (kW) solar PV array.  I’d hoped to get a sense for how quickly he’d pay off his array with the net metering revenue.  I was shocked. Payback time was 30 years.  Even if the business owner had received … Read More

We’ll be back next week

Date: 31 May 2011 | posted in: Energy, Energy Self Reliant States | 1 Facebooktwitterredditmail

John Farrell is on leave to spend some quality time with his new daughter.  Look back June 6 for more great distributed generation content and an announcement of a new report on distributed generation!

We’ll give you some time insensitive material this week we’ve been saving.

Read More

1 62 63 64 65 66 67 68 115