
Executive Summary
The economy has stalled and so has the war on climate change. But dozens of cities are creating jobs and cleaner energy using their own power.
Download the Report
Keeping Energy Dollars Local
C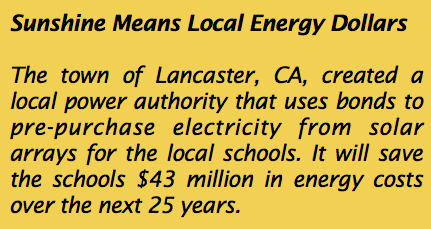 hattanooga, TN, is adding over $1 billion to its local economy in the next decade by implementing one of the most advanced smart grids and delivering the fastest internet service in the country with its municipal utility.
Sonoma County, CA, has created nearly 800 local jobs retrofitting over 2,000 properties for energy savings with city-based financing.
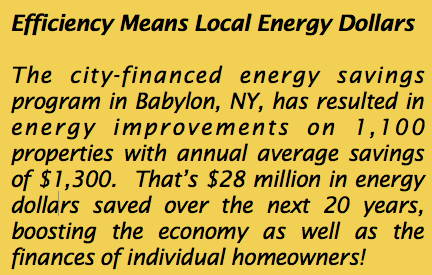
Babylon, NY, has re-purposed a solid waste fund to finance retrofits for 2% of the city’s homes, saving residents an average of $1,300 a year on their energy bills at minimal cost to the city.
 Eight Powerful, Practical Policies
This report details eight practical energy policies cities can and have used to their economic advantage:
- Municipal utilities
- Community choice aggregation
- Building energy codes
- Building energy use disclosure
- Local tax authority
- Solar mandates
- Permitting
- Local energy financing
Case studies of each policy vividly illustrate their impact with specific examples, right down to the text of the relevant ordinances.
The policies aren’t tied to a political ideology, but a practical and local one. Cities have identified where they have untapped resources and deployed them to generate jobs and keep more of their energy dollars in the economy.
Every City Could Do Something
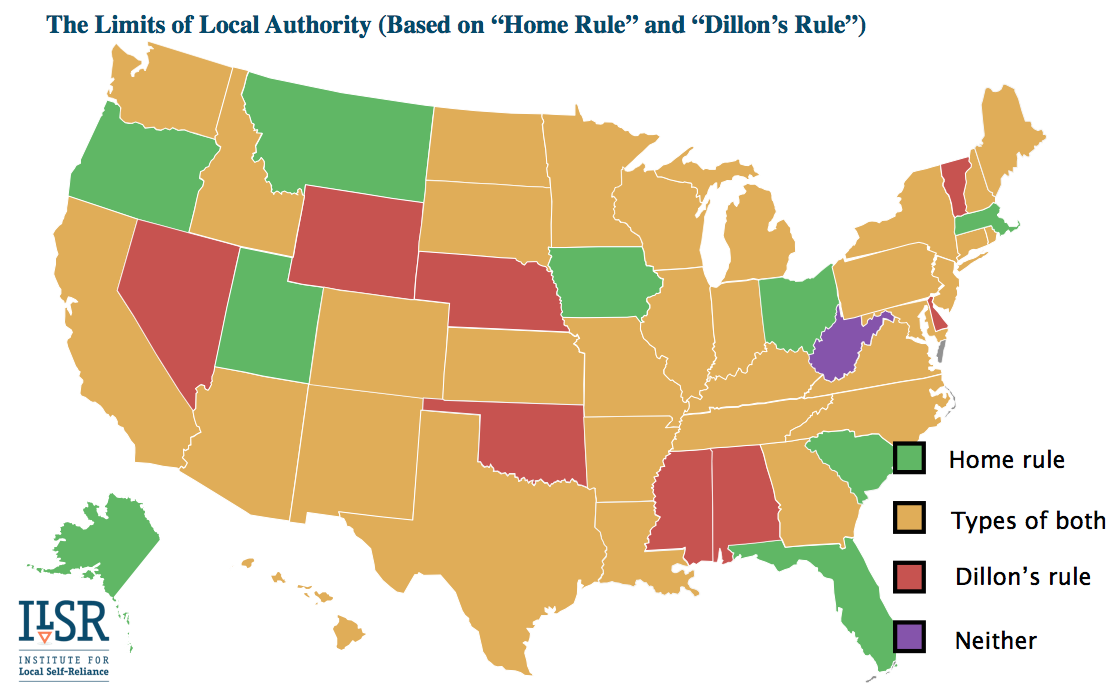
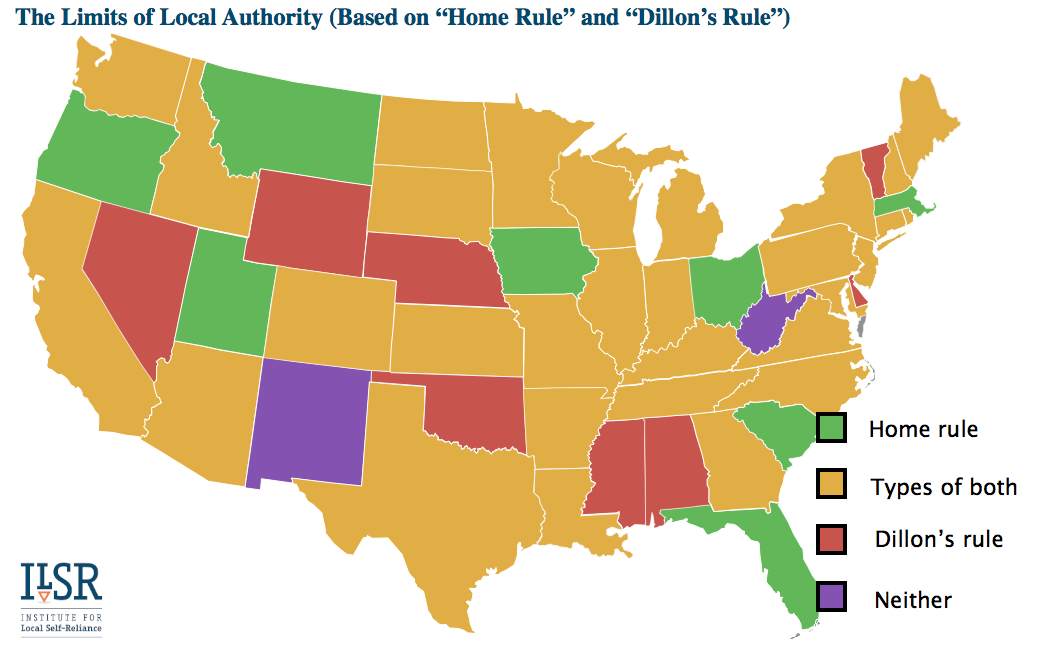
Some cities are more limited than others. While the federal constitution typically reserves all powers not expressly given the federal government to the states, states typically do not similarly reserve powers for cities. In fact, an opinion issued by Justice Dillon of the Iowa Supreme Court in the mid-1800s (Clark v. City of Des Moines) set a precedent for local authority that extends to this day in most states: many cities have only those powers expressly granted them by the state or that are indispensable in being a city. Issues like energy codes or property assessed clean energy programs don’t fit under “Dillon’s Rule.”
On the other hand, many states have instituted a form of “home rule,” that grants (at least some) powers of self-governance to cities. The following map illustrates the complex landscape of local authority.
No city, no matter how committed to boosting its economy, could adopt all eight policies (heck, the first two are incompatible). Forming a municipal utility means a tough fight with the incumbent utility. Few states allow community choice aggregation.
But nearly every city has a local budget and borrowing power, can issue permits for buildings, and can set local policy. And likely no city has explored the full potential of their power to boost the local economy with local energy policies. This report shows how dozens have done so, in the hopes it inspires many more to act.
Acknowledgements
Thanks to Don Knapp at ICLEI and David Gabrielson at PACENOW for their prior research in this area and to the many wonderful readers of my weekly newsletter who provided excellent examples of local energy leaders. All errors are, of course, my own responsibility.
Contact John Farrell ([email protected]).
Introduction
Municipalities across the country can’t afford to wait for the federal or state government to rescue their economies or their environment. The national “Great Recession” has officially passed, but (as the chart below shows) joblessness lingers even as government’s attention turns to other matters. Similarly, national attention to climate policy has waned, despite the continued urgency.
Cities don’t have to wait to juice their economy, and they can do it with clean energy policies that simultaneously attack our most pressing economic and environmental problems.
This report lists 8 powerful policies and practices that cities have employed to reduce energy use, save money, and create local jobs, all without waiting for someone else to act. It provides short case studies of the policies in place, and links to the text of the local rule.
It is our hope that your community can use these models to take control of its energy future and keep more of its energy dollars in the local economy.
Municipal Utilities
 Over 2,000 U.S. communities, home to 1 in 7 Americans, get their electricity from city- owned utilities. These locally controlled, not-for-profit electric companies offer many benefits, from responsive local staff to better reliability to lower borrowing costs to higher revenue for a city’s general fund.
Not every municipal utility is a forward- thinking, clean energy champion, any more than investor owned or cooperatively owned electric utilities. But municipal utilities are uniquely subject to the will of their customers (who elect their superiors). A few communities have pioneered programs that show how a locally owned electric network can not only reliably and inexpensively deliver electricity, but can also successfully marry environmental and economic goals.
Many municipal utilities are exempt from state- level regulation, enabling them to serve their community as they see fit. They can choose their energy supply – the type and location. They can invest in smart grids or customer service. Ultimately, they can do whatever their boards, city councils, and voters wish. Boulder, CO, provides a perfect illustration, where a feasibility study of forming a municipal utility shows the city could reduce greenhouse gas emissions by 50% by getting 54% of their energy from renewable sources within 5 years, with no negative impact on rates or reliability.1
Most municipal utilities were established decades ago, when corporate utilities often refused to adequately serve their community. Some municipal utilities have arisen more recently (although fewer than 100 municipal utilities have been formed in the past 30 years).2 In many cases, cities only gained control of their energy future and utility after a major fight with the incumbent investor-owned utility.
Sacramento Municipal Utility District
The Sacramento Municipal Utility District (SMUD) serves 600,000 customers in and around the state capitol of California. SMUD has an ambitious goal of reducing greenhouse gas emissions by 90% by 2050.
SMUD has served the Sacramento area since 1946 and is run by a board of seven publicly elected officials, who serve four-year terms.
SMUD got its start with a struggle, a 23-year legal battle with incumbent corporate utility Pacific Gas & Electric for the right to serve Sacramento customers.3
SMUD was an early leader on solar technology and renewable energy, constructing the first utility-scale solar farm (initially 1 megawatt (MW), now expanded to 3.2 MW) in 1984.4 In 1993, it launched the Solar Pioneer program that allowed SMUD customers to pay a modest premium to get solar installed on their roof. Combined with solar on carports and other locations, it gave the utility valuable experience with managing over 600 distributed solar projects with a total capacity of over 7 MW by the year 2000 (about 10% of all solar PV installed in the U.S. at the time).5
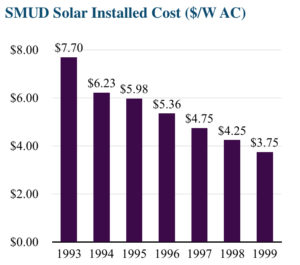 Buying in bulk helped reduce solar installation costs significantly. By 1999, residential rooftop installations sponsored by SMUD cost just $3.75 per Watt (AC),6 less than half the average cost for similarly sized projects in the U.S. and equal to the average cost nationwide at the end of 2012!7
SMUD’s first wind farm was built nearby in 1994 and has since been expanded to over 100 MW. SMUD currently purchases electricity from 230 megawatts (MW) of wind power and 100 MW of solar, almost all within its own system (equivalent to about 10% of its peak energy demand), and 28% of its energy sales are from renewable sources. The utility is on target to reach the state standard of 33% renewable by 2020.8
Thanks to citizen pressure, SMUD has also invested heavily in energy efficiency. The efforts were sparked by the closure of the Rancho Seco nuclear power plant in 1989 after a public referendum, the only such closure in the history of nuclear energy (due in large part to its pitiful 38% lifetime efficiency rating). The municipally owned utility responded with a “massive” energy efficiency program including planting a half million trees to reduce air conditioning demand in Sacramento. The Sacramento Bee summarized, “SMUD aggressively promoted energy-saving programs, including fluorescent bulbs and light- colored roofing, which were novel concepts at the time.”9

In addition to energy efficiency, SMUD’s investment in hydroelectric power and other energy sources after the closure of the nuclear plant have helped it offer an average retail electricity rate is 25% lower than the state average for investor-owned utilities.10
SMUD also maintains a very reliable grid system, with the average customer losing power for less than an hour per year, significantly better than the national average.11 The utility is testing new technologies for system resilience and reliability, like microgrids, at their new headquarters building (also a zero net energy building).
In its energy program, SMUD stands out for its commitment to keeping energy dollars local. It was one of the first to offer a comprehensive, long-term contract to local solar producers that could deliver power to the utility. By 2012, the entire 100 MW program had been filled, with 66 MW producing electricity, costing the utility a low (at the time) 12¢ per kWh.12 They’ve also aligned their energy efficiency incentives with the city’s energy financing program (Clean Energy Sacramento), helping to save their customers energy and create local jobs through building upgrades and retrofits.
The utility has also been at the center of transitioning to a 21st century grid. SMUD started adding electric vehicles to its fleet in 1990 and built nearly 150 public charging stations through 2003.13 They have a pilot pricing program, providing lower cost electricity for electric car charging at off-peak hours. They’ve also participated in several studies on using electric vehicles for energy storage and to increase the penetration of wind power.14,15
Austin Energy
Serving nearly a million residents in one of the largest cities in Texas, Austin has one of the most ambitious renewable energy goals and a strong history of energy savings.
The utility has served the city of Austin (and parts of two surrounding counties) since the beginning of the 20th Century. The utility is governed by the Austin city council.
Austin Energy has one of the most ambitious renewable energy standards of any utility or state, committed to 35% renewable energy (from within Texas) on its grid by 2020. This plan will reduce greenhouse gas emissions 20% below 2005 levels by 2020. In 2012, 15% of the utility’s supply came from renewable resources.
With its strong local resource, and peak summer demand the Austin utility has focused on solar energy. Its net metering program (supported by robust rebates) has helped cultivate approximately 8 MW of in- city solar energy, mostly on (over 1,000) residential rooftops. The incentive programs continue to add 1 MW or more of solar each year. The utility also recently completed a 30 MW utility-scale solar installation about 18 miles east of town.16 Combined, the city’s solar installations are a relatively small amount of the total electricity, representing just 1.4% of peak energy demand, but the city plans to have 200 MW of solar installed by 2020.

The utility has also had a strong focus on energy efficiency, starting in the early 1980s. Its rebates and low-interest loan programs reached more than 100,000 customers between 1982 and 2000, and its Green Building program has helped builders construct energy efficient homes (nearly 700 in 1999 alone, and 10,000 since 1991).17,18 The utility also supports the city’s ambitious building energy code, that includes mandatory energy audits for all residential and commercial buildings older than 10 years. In partnership with a local credit union, the utility provides loans for energy improvements on residential properties.19
The city utility also requires homeowners interested in the solar rebate to make energy efficiency improvements first.
Austin Energy also operates the local version of the federal energy efficiency program Free Home Energy Work, that has served over 14,000 homes, and saved 19 MW of power.20 Its low-income weatherization programs funded by the federal stimulus have outperformed expectations, reaching nearly 1,900 homes, 77% more than expected. This and other energy efficiency programs have also reduced peak demand by 48 MW, or about 1.7% of peak, in 2012.21 Austin’s annual combined energy savings averages around 0.8% of total energy savings, putting them in the top third of large utilities ranked in a 2011 report by Ceres.22
Like SMUD, Austin Energy has better-than- average reliability, with customers losing power an average of 60 minutes per year or less over the past five years.23
 Austin has partnered with many private companies to test the 21st century utility model with its Pecan Street, Inc., project. The independent project has tested out advanced smart grid technology, distributed generation, solar power, electric vehicles, and other elements of a modern electric grid in specific geographic neighborhoods within the city of Austin.
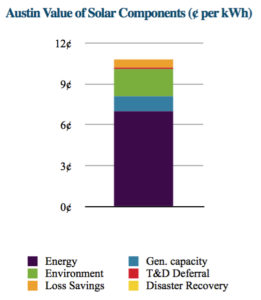
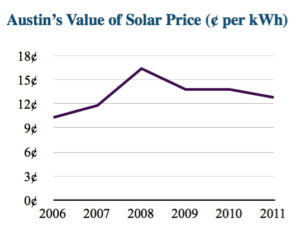
Austin has also supported the development of local solar resources, by pioneering a new concept: a “value of solar” production-based incentive. Currently set at 12.8¢ per kilowatt-hour, the incentive adds up various ways that local solar energy saves the utility money (including avoided energy costs, transmission of energy and losses, and other factors), and sets an appropriate payment level, adjusted annually, for solar energy producers.
Palo Alto Utilities
About an hour south of the Bay Area, the electric utility serving the wealthy town (per capita income is nearly double the state’s) of Palo Alto has made itself into a clean energy leader. It has signed contracts to have a carbon-neutral electricity supply beginning in 2013, in part due to purchasing solar energy at historically low prices.
The Palo Alto electric utility has been serving the city (population 65,000) since 1896, and includes almost all local utility services (water, gas, electricity, wastewater) including a fiber optic network (for city use). The utility operates with relative independence from city council, with an appointed director.
 The utility has two top-line commitments on renewable energy: to be 33% renewable by 2015, adopted in 2007,24 and to be 100% carbon-free. In 2007, the city received 10% of its energy from renewables, rising to 20% in 2010. By 2013, the city has signed power purchase contracts that will get it to 48% renewable by 2017, blowing past its goal.25 Along with previously contracted large hydro power (not counted as renewable according to state law), and the purchase of short-term renewable energy credits, the city will meet its carbon- free goal beginning this year, as well.
The commitment started a decade ago, with a 100% green energy option for customers, with a price premium of 1.5¢ per kWh. Over 1 in 5 customers participates, among the highest rates in the country, supporting solar installations around the state. The city council recently suspended the price premium due to the low cost of acquiring renewable energy and the commitment to deliver carbon neutral energy to all customers.26
 More recently, the utility has committed to buying solar in bulk, signing 100 MW worth of solar contracts in the past year at an average and historically low price of 7¢ per kWh (much lower than the retail electricity price). The energy will come from utility- scale solar arrays in rural counties in Southern California.
Palo Alto utilities also runs a robust energy efficiency program. Its 10-year goal of 3.5% load reduction (adopted in 2007) and subsequent efforts are projected to keep electricity demand flat from 2010 through 2030.27,28
Palo Alto delivers electricity service with high reliability. The average customer is out of power for 50 minutes per year, only about half as much as a customer served by the region’s investor-owned utility.29
The utility has also focused on the purchase of local solar power. Approximately 6.5 MW have been developed on residential and commercial properties with city-offered rebates. The city also recently launched a CLEAN Program to purchase local solar energy, offering 16.5¢ per kWh for solar from city rooftops. Although much higher than the cost of utility-scale solar, the local purchase price is based on the value of the energy to the city, including the 3¢ per kWh it offsets in transmission and capacity costs.30 The price is higher than for Austin, TX, in part because of a higher value for avoiding transmission costs and partly because higher land values in Palo Alto make it necessary to do more rooftop rather than less expensive ground-mounted commercial scale solar energy.
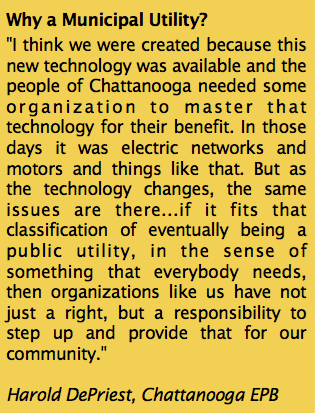
Chattanooga Electric Power Board
The Electric Power Board (EPB), the municipal electric utility serving Chattanooga, TN, has become a national model for using smart grid technology to improve electric service, offering world- class internet service, and saving the community money.
EPB was created by the state legislature in 1935, to deliver inexpensive power from the Tennessee Valley Authority (TVA). It serves the city of 170,000 and surrounding area.
Since EPB gets all of its energy from TVA, it has no authority over the amount of renewable energy on its electricity system. TVA is primarily a coal and nuclear power system (80%), with a significant part of the remainder of its power from large hydro dams. TVA has started procuring small amounts of solar and other renewable energy through standard, long-term contracts (like Palo Alto) but its plans will not significantly change its energy mix.
On energy efficiency, EPB has focused on its signature achievement – one of the most advanced smart grid in the country. Built on a fiber optic network that also delivers some of the most cost-effective and fast internet service in the country, EPB’s smart grid story is worth telling.
Initially the municipally owned utility used fiber connections between substations to offer affordable and reliable telecommunications services to nearby businesses. But the foundation of their current success was a plan to build a citywide fiber optic network to serve their electric division (and then to see how it could also be used to offer other valuable community services).
Their smart grid plan, developed in 2007, envisioned a 10-year build out of a fiber optic network close to most buildings in the city. Smart meters would communicate wirelessly with the fiber network.
Although it was prepared to finance the upgrade itself, a $111 million federal grant allowed EPB to complete their smart grid investment in 2012, seven years ahead of schedule. The utility now has the most automated smart grid in the country. Advanced sensors on the distribution system give the utility thousands of data points every second to improve the quality of power. Smart switches, called IntelliRupters, are installed, on average, between every 150 buildings. These switches can automatically section off the grid during outages to minimize affected areas.
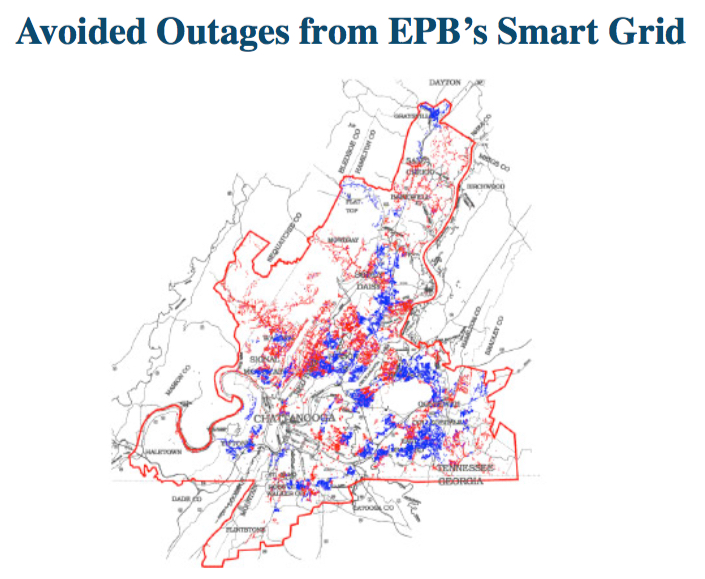
The investment is paying dividends. EPB estimates that in the 9 months ending February 2012, their smart grid investments saved customers an average of 30 minutes of outage time apiece – enough to cut the average U.S. utility’s annual outage time by 33%.31 Not counting weather-related outages, their average outage time through August 2013 was 21% lower than for the same time the previous year.32
The following map helps illustrate the improvement based on a single outage event caused by a thunderstorm on July 5, 2012.
The smart grid automation saved the utility $1.4 million, in part by preventing over 300 truck runs that would normally have been ordered to confirm outage status. It also saved residential and commercial customers millions by avoiding power outages (estimated at $50 million per year),33 a benefit more commonly counted by a municipal utility than a privately owned one.
The smart grid also includes advanced electric meters, with data that can provide the utility with opportunities to significantly improve efficiency. “The utility may be able to shave 20 to 30MW off its peak electrical load because it knows exactly what the voltage is at the last house down the line of every distribution run.”35
The savings to the community also come from investments as simple as new street lights. Like many other utilities, EPB is replacing older street lights with LED technology, reducing energy use by up to 50%. But the LEDs used in Chattanooga are “smart,” allowing for remote control using the city’s wireless internet network. In a report on Chattanooga’s smart grid, Chris Mitchell notes that, “These lights can be a boon for public safety because police officers can increase light output as necessary on a granular basis. While responding to an incident in a park, first responders can flood the area with enough light to make midnight seem like midday. The lights can also be flashed in a pattern, directing motorists along a specific route.”36 The smart controls increased energy savings from 50 to 82%, because the lights could be dimmed based on local conditions and needs. The light upgrade will pay for itself in 6 years and reduce maintenance costs, since LEDs need replacement much less frequently than the older lighting technology.
The fiber network makes excellent sense for the electric utility, but it also has enormous benefits for the city’s residents and businesses. The network, which launched services (TV, phone, and internet) in late 2009 with one of the fastest internet packages in the country (100 Mbps symmetrical download and upload). After a year, Chattanooga’s utility became the first service provider in the country to offer 1 Gbps service (equal to 1000 Mbps and about 50 times faster than a common home cable internet connection). Prices were comparable for EPB’s service to its for-profit competitors, and service was always better.37 The economic value (over 10 years) of the city-provided service is estimated at close to $600 million, nearly twice the network’s cost of $300 million.
EPB also excels in other ways, like customer service. They ranked #2 among large U.S. utilities for customer service, in no small part due to gestures like service credits for internet customers during an extended outage in 2011 (something private providers almost never do).38 It also uses its smart meter data to inform customers if their power use has unexpectedly spiked, helping them avoid bill surprises. Some commercial customers, so impressed with the utility’s reliability, have opted not to purchase expensive, redundant electric feeds.
Other Municipal Leaders
Several other municipal utilities have noteworthy accomplishments. Seattle City Light has energy efficiency programs saving 1% of sales per year. Denton, TX, already serves its customers with 40% renewable energy in 2013.
Others have local procurement programs for clean energy. These include municipal utilities in Gainesville, FL; San Antonio, TX; Long Island Power Authority, NY; Los Angeles Department of Water and Power, CA.
Community Choice
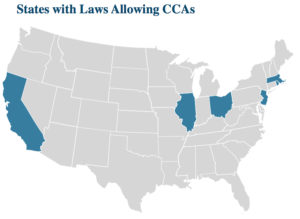
In most states, a city wanting to change its energy future has two options: beg its utility or form its own. But one state-level policy opens a third way for cities to have more choice over their energy options: community choice aggregation (CCA).
Now authorized by legislatures in 6 states, community choice aggregation has been called “municipalization lite,” allowing cities to control both the cost and amount of renewable energy in their energy mix without buying the electric grid. Instead, the community picks the power sources and the existing electric utility maintains the grid infrastructure.
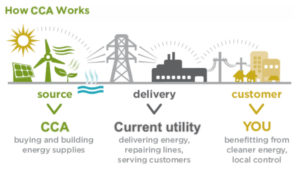
Once a state law is in place, the local governing body can explore the formation of a CCA (henceforth called “community utility”). This process usually includes a feasibility study examining the setup costs as well as the potential savings to consumers, increased energy savings, and increase in renewable energy. Next, a vote must occur within the governing body or via public referendum (state laws vary) to form a community utility. A municipal governing body typically develops a plan outlining governance, a financial plan, and a process for making changes to rates, energy supply, etc.39 Each participating municipality must pass an ordinance to join the community utility.
The basic principle is that residential and small commercial customers are “aggregated” by a municipality, which becomes their negotiator with energy companies. The city or country (or an amalgamation of several) solicits bids for electricity to serve this aggregation of customers. Individual customers can opt- out of the community utility and remain with the current utility provider.
 Most communities that have joined or formed a CCA have primarily focused on lowering the cost of energy and energy efficiency. The Cape Light Compact in Massachusetts has served 200,000 customers in over 20 municipalities since the late 1990s, negotiating lower electricity prices. The Northeast Ohio Public Energy Council is the country’s largest CCA serving 134 communities, and has achieved lower electric bills and less polluting power sources since its formation in 2001.40
The California CCA market has several prospective entrants after nearly a decade of legal battles between supporters of early CCA efforts and Pacific Gas & Electric. The issue was finally resolved after PG&E lost a ballot measure to restrict CCAs and additional state legislation was passed requiring PG&E and other incumbent utilities to cooperate fully with communities seeking to form CCAs.
Some newer CCAs have had a sharper focus on cleaner energy, and in some cases, have used the opportunity to focus on keeping more energy dollars in the community.
Marin Clean Energy
The community utility serving 125,000 customers in Marin County and Richmond, CA, was authorized in 2008 by a unanimous vote of county supervisors and launched in 2010 with an immediate focus on cleaner energy.41 Participating communities joined the community utility by enacting a local ordinance.
The Marin Energy Authority’s default electricity service is 50% renewable, with renewable power (or credits purchased from Shell Energy) supplied from wind, solar, and biomass projects in California, Oregon, and Washington. Customers can also pay a premium for 100% renewable energy service.
Clean isn’t the only focus. The community utility intends to save a nation-leading 2-3% of annual sales with energy efficiency, by increasing incentives, providing financing through the utility bill, and aggressive marketing.42 They also intend to use demand response programs (e.g. cycling customer air conditioners during times of peak energy demand) to reduce the peak energy use of the utility by 5%.43 Such measures can reduce energy costs by using less, avoiding purchases of expensive energy when it is in short supply, and by shifting energy demand to periods when energy is less expensive.
The community utility also intends to increase local procurement of energy, touting its economic benefits. So far, they buy power from a 972 kW solar project at the local airport that was built with local labor, and financed at a local bank.44 The utility’s resource plan calls for up to 10 MW of local distributed solar energy. Contract prices start at approximately 14¢ per kWh for the first 2 MW of capacity, and are reduced for each additional 2 MW tranche of capacity added, to 10.5¢. So far, the program has subscribed close to 2 MW. If the program is completely subscribed, it would supply about 20% of the community utility’s renewable energy.
Oak Park
Oak Park is one of hundreds of cities in Illinois that adopted municipal aggregation in 2011 and 2012. Abnormally high electric rates from incumbent utility Commonwealth Edison led many of these communities to change suppliers, with rate savings of 25-30% for customers.
In April 2011, Oak Park adopted a CCA by public referendum, as required by Illinois law.45
Oak Park differs from other cities in the state because its aggregation program is buying renewable energy credits from regional wind farms sufficient to cover all of the electricity sales for its customers, making it “100% renewable.” This practice is somewhat controversial (see RECs and Rascals sidebar).
The city is also considering adding in a locally managed energy efficiency program, like Marin Clean Energy.46
Challenges with CleanPowerSF
Since passing an ordinance in 2007, the city of San Francisco has been investigating community choice aggregation, but the proposed community utility still faces several roadblocks.47
The city’s public utilities commission (SFPUC) has been working for three years on the implementation of a plan, approved by the Board of Supervisors (city council) in 2010, to deliver 100% renewable energy to the city’s residents and small businesses. The plan would come at a monthly premium to existing electricity service from incumbent monopoly utility PG&E. Original forecasts had energy prices doubling, but revised rates would increase costs by about $5 per month for residential customers.
But while the proposed program would rapidly shift the city’s energy supply to clean sources, it’s not clear that it would result in any new (or local) renewable energy. Like Marin Clean Energy, CleanPowerSF contracted with Shell Energy (a subsidiary of Shell Oil) to buy renewable energy credits to fulfill anywhere from 45 to 85% of the clean energy supply,48 with promises to focus on more local energy generation in the future. Mayor Ed Lee is critical of the program’s renewable energy claims and the perceived lack of local economic development.
The program is temporarily on hold after the city’s public utility commission refused to set rates at their August 2013 meeting, after nearly a year of debate.49 Furthermore, the commission and mayor have indicated an interest in using money set aside for CleanPowerSF to repair water and power infrastructure damaged in the 2013 Rim Fire near Yosemite National Park and the Hetch Hetchy reservoir.50 If that happens, it may halt the progress toward a community utility indefinitely.
For More Information
CCAs are growing in several places around the country. Activists in San Diego have formed an Energy District campaign for a CCA. Sonoma County, known for its leading PACE program, has already completed a feasibility study showing it could get up to 60% of its power from local sources.51 Their aggregation, Clean Power Sonoma, is scheduled to launch in early 2014 with 33% renewable energy, rising to 50% by 2018.52
CCAs also continue to expand in Illinois and Ohio, where retail electricity deregulation or earlier authorizing laws have removed major barriers.
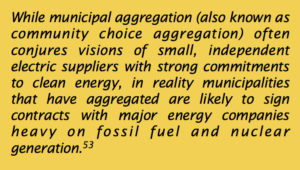
While CCAs grant local control, they are not necessarily about local energy, as Midwest Energy News reports:
For example, Marin Clean Energy contracts with a Shell Oil subsidiary for its renewable energy certificates, as does Oak Park and Cincinnati, OH. San Francisco’s CCA is being held up in part by the perception that it is just switching corporate overlords and doing too little to shift to clean, local power.
Much like a municipal utility, a CCA is simply a tool that provides a community with more opportunity to clean and localize its energy future, but it’s no guarantee.

Building Codes
Building codes establish minimum standards for building safety and energy use, and they are one of the most effective and cost-effective ways for communities to save energy dollars.
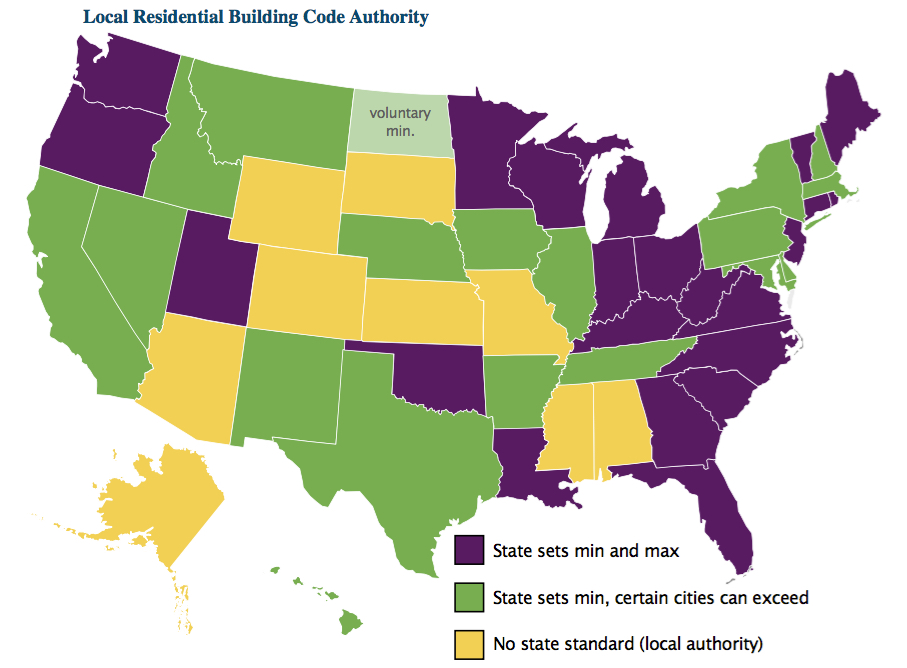
States generally set minimum standards for energy performance of buildings. Typically, these codes apply to new construction, and differ for residential and commercial buildings. All but 8 U.S. states set residential building codes at the state level, and all but 7 set commercial codes at that level.54
Many states also allow some or all cities to set their own, higher standards. The following map shows which states allow some or all cities to set building energy codes locally. The U.S. DOE publishes a regular map of currently adopted state energy codes.55
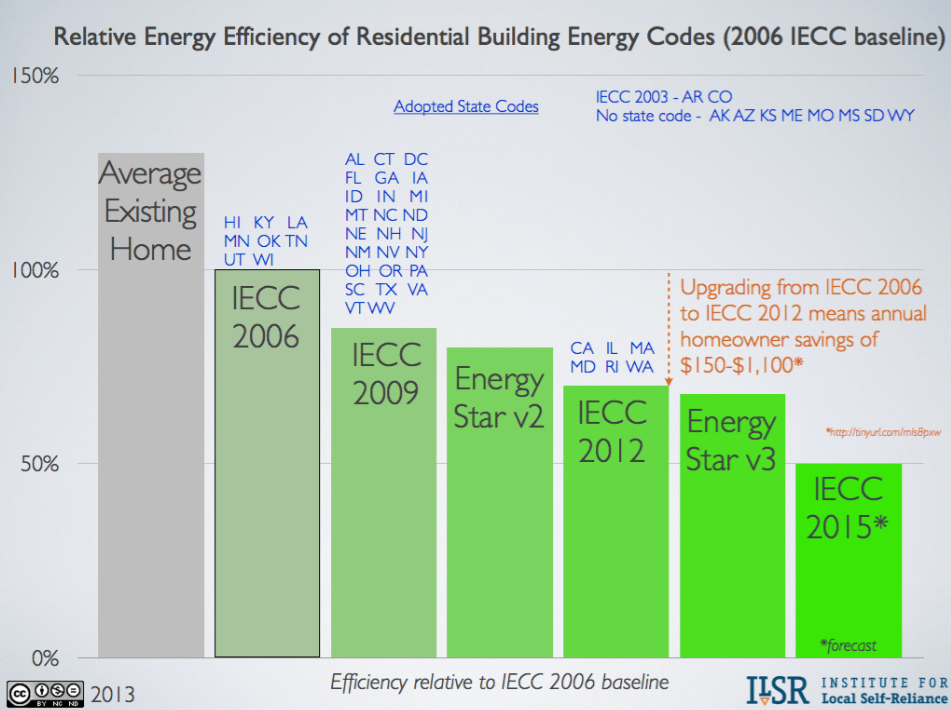
The communities that use this authority can save millions in energy costs over the lifetime of their buildings, and accelerate their progress toward a smaller climate footprint. To get a sense of the benefits of action on energy codes, the following graphic shows the relative efficiency of typical energy codes for buildings.56 The most common is the International Energy Conservation Code (IECC). The IECC codes are prescriptive standards: setting new energy efficiency targets for buildings and detailing the specific measures builders must take to meet those standards. Adopting new codes can make a significant difference for new buildings. For example, a community that adopts the 2012 IECC in replacement of the 2006 version will save the average homeowner anywhere from $150 to $1,100 per year in energy costs.57
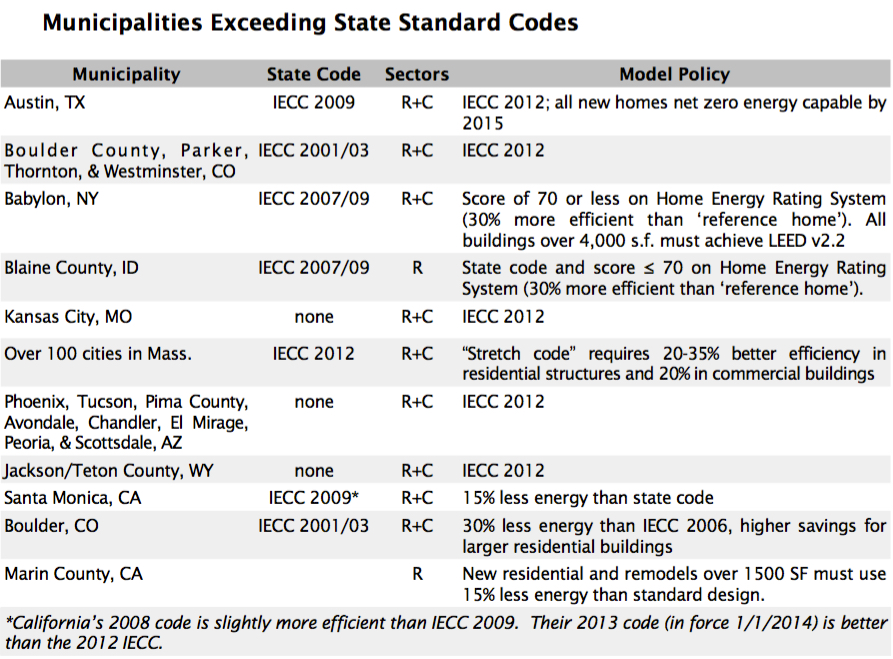
As shown in the following table, many municipalities that have the authority to exceed state standards have done so, recognizing the cost-effectiveness of action. Many have adopted the latest IECC Code (2012) and others specify an improvement relative to the state standard (e.g. Massachusetts cities and Santa Monica, CA).
Future improvements in building energy efficiency may be easier. Major environmental groups have recently reached an accord with home builders – who frequently oppose code updates because of higher upfront costs – to implement a residential building performance standard that is 20% better than IECC 2012.58 The standard would give builders more flexibility than the current IECC standards, because the methods of measuring performance in the proposed standard are easier and less costly than those typically allowed under state-adopted IECC standards.
The accord may also help address the major failing with building codes – enforcement. While many states set energy codes, they often leave enforcement to cash-strapped cities. The Institute for Market Transformation estimates that compliance with building energy codes is as low as 50% in some areas, but that every $1 spent on enforcement returns $6 in energy savings.59 See IMT’s state-by-state interactive map on potential energy savings from improved enforcement.60
For More Information
Austin, TX, energy code61
Boulder County, CO, energy code62
Babylon, NY, energy code63
Seattle, WA, energy code64
Massachusetts state “stretch” energy code65
Santa Monica, CA, energy code66
Marin County, CA, energy code67
Local Taxing Authority
Few things can accomplish more than the local power of the purse, and at least two municipalities have used local taxes to power up their economy and advance clean, local energy generation.
Boulder’s Carbon Tax
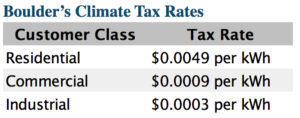
In Boulder, CO, citizens approved a local carbon tax on electric bills in 2006 to finance investments in energy efficiency and local renewable energy. The tax, increased to the maximum authorized amount in 2009, generates approximately $2 million per year. The rate per kilowatt- hour varies by customer class, shown below.
 Most of the carbon tax revenue supports the EnergySmart program that conducts energy audits of residential and commercial properties and makes recommendations to building owners about potential energy savings. The tax revenue also supports solar rebates (Boulder has some of the most solar energy per capita in the U.S.) and energy conservation programs for businesses.68
The carbon tax in Boulder is part of a broader effort to move toward energy self- reliance, including building energy ratings, a climate action plan, the most recent international building energy code, and voter authorization to pursue a municipal electric utility to ramp up renewable energy development.
For more information, see the Climate Action Plan Excise Tax in Boulder’s city code.69
Babylon’s Innovative Solid Waste Fund
In Babylon, NY, town leaders repurposed an existing fund to energy savings. The municipal solid waste fund had a surplus, and town officials wanted to use that money to help residents save money on their energy bills. They changed their town’s definition of solid waste to include carbon emissions,70 allowing them to use the collected funds to set up one of the first and most successful PACE programs for financing energy efficiency improvements.
Read more in our PACE Program section or see the definition of solid waste used by the Town of Babylon.71
Solar Mandates for New Homes
While some cities have focused on reducing energy use to keep more money in the local economy, others have focused on producing (rather than importing) more clean, local energy.
Lancaster
Lancaster, CA, made waves in the spring of 2013 when its city council unanimously approved revisions to their zoning code, requiring new housing developments to average at least 1 kilowatt of solar PV capacity per home.72 Developers must meet the requirement for every phase of development, but the code allows them to aggregate the requirement into larger projects.73
“We want to be the first city that produces more electricity from solar energy than we consume on a daily basis,” Mayor R. Rex Parris said in an interview with the New York Times.
Meeting the mayor’s solar goal requires a total in-city generating capacity of 216 megawatts (a world-leading 1.44 kilowatts of capacity for every resident in the town of 150,000). About 90 megawatts are already producing power or are in development.74
Lancaster also created a power authority to attract solar investment. The authority has partnered with various private companies, including SolarCity, to share revenue from solar power purchase agreements. For example, the power authority will issue bonds to prepay for electricity from installed solar arrays and sell it to area schools. City staff estimates the city’s schools will save $43 million in electricity costs over the 25-year term of the agreement, and the power authority will recover 130% of the debt service payments in selling the energy to the schools.75
Sebastopol
Sebastopol, CA, followed shortly behind Lancaster in 2013. Their ordinance is more ambitious, requiring solar installations on new homes to provide 2 Watts per square foot (e.g. 4 kW for a typical 2,000 s.f. home) or offset 75% of the home’s electricity use.76
Permitting
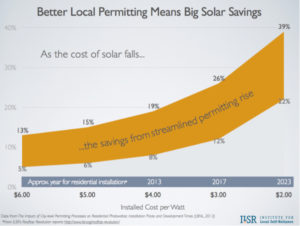 One authority almost all cities retain is the power over zoning and permitting for renewable energy installations, and practices vary widely. Perhaps unexpectedly, permitting costs can make up a very significant portion of the installation cost of a renewable energy project, like rooftop solar, especially as the cost of solar energy continues to decline.
The graphic illustrates that best practices in permitting cut the cost of a 2011 residential solar installation by 5-13%, but could reduce the cost of a solar project installed 10 years from now by nearly 40% because as solar prices decline, soft costs like permitting take up a much larger share of total costs.
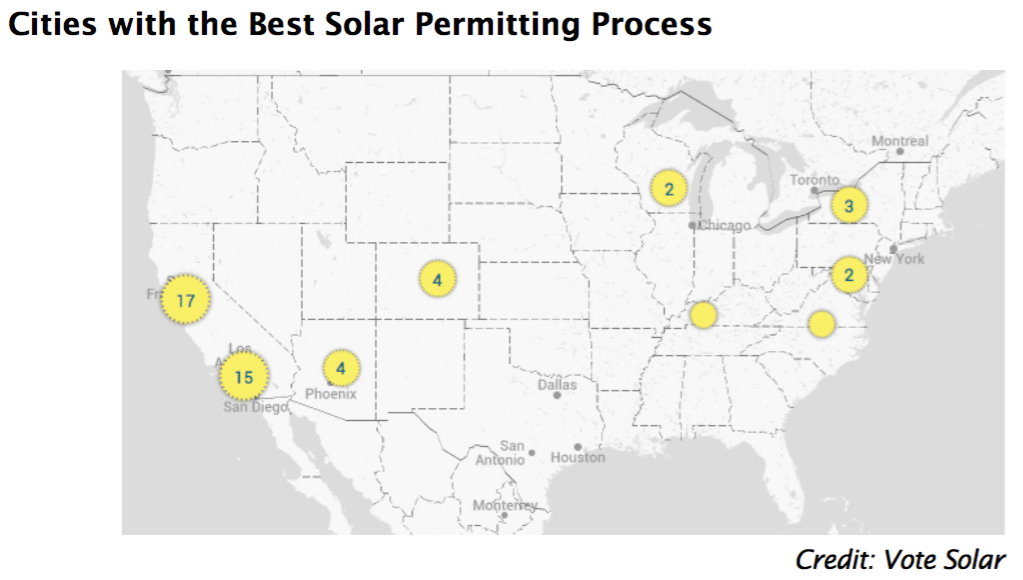
The best city policies make permitting simple and inexpensive, offer online applications with quick turnaround, are harmonized with other regional permitting policies, and minimize inspections.
Vote Solar’s Project: Permit has an interactive map that shows the communities with the best policies, including Madison, WI; Pueblo County, CO; and Davidson County, TN. View the map at projectpermit.org.
The criteria for a better permitting process on their map includes:
- Posting permitting requirements online
- Allowing online permit processing
- Fast turn around time (1-3 days)
- Reasonable, cost-based permitting fees
- No community-specific licenses required (use state licensure requirements)
- Narrow inspection appointment window
- Eliminating excessive inspections (1 only)
Energy Disclosure Ordinances
When shopping for a home or office, prospective buyers are often in the dark about a building’s energy use. Cities have come to the aid of buyers, enacting rules requiring building owners to disclose standardized energy usage metrics.
Several cities and states started over a decade ago with disclosure requirements for public buildings, but a few pioneering cities have had policies for private buildings for years. Chicago, IL, for example, has required residential rental property owners to disclose heating bills to prospective buyers since 1987.77 Montgomery County, MD, requires all residential property owners to disclose heating and electricity bills for the prior 12 months to prospective buyers.78
In recent years, the effort to make energy a part of the building purchase decision has spread, helping create a market for more energy efficient buildings.
A common strategy is to require larger commercial buildings to disclose energy and water use using the Environmental Protection Agency’s (EPA) Energy Star Portfolio Manager, already home to benchmarking data for 40% of U.S. commercial building space.79 The table below shows the cities that have enacted energy disclosure ordinances, the types of buildings the existing ordinances apply to (commercial by size, public, and residential multifamily), who can access the disclosure, and required action of the building owner.80
Early results of the enacted policies (from Austin and New York City) suggest that the policies can have high compliance rates and financial benefits for owners of highly rated (e.g. efficient) properties.81 A 2013 report by Northeast Energy Efficiency Partnerships also shares some of the key lessons learned from these early polices. Among the lessons are: local government can lead by example; energy rating disclosure must be simple to understand and timely (so prospective buyer/renters can use it); utility participation is extremely important to be able to access building energy data (made easier in Seattle and Austin, which have municipal electric utilities).82
| Municipality | C-Size | Public Bldg? | Multi-family? | Disclosure | Requirement |
| Austin, TX (click for ordinance) | 10,000 SF | Y | Y | Buyers/sellers | Audits/upgrades for multifamily |
| Boston, MA (click for ordinance) | 35,000 SF | Y | Y | Public (2015) | Audit for low performers |
| Minneapolis, MN (click for ordinance) | 50,000 SF | Y | N | Public | N/A |
| New York, NY (click for ordinance) | 50,000 SF | Y | Y | Public | Energy audit |
| Philadelphia, PA (click for ordinance) | 50,000 SF | Y | N | Buyers/sellers | N/A |
| San Francisco, CA (click for ordinance) | 10,000 SF | Y | N | Public | Energy audit |
| Seattle, WA (click for ordinances) | 10,000 SF | Y | Y | Buyers/sellers | N/A |
| Washington, D.C. (click for ordinance) | 50,000 SF | Y | Y | Public | N/A |
PACE Programs
Property Assessed Clean Energy (PACE) programs set out to overcome a key barrier to financing clean energy and energy efficiency: nobody wants to pay for energy improvements that won’t pay off before they sell a property.
PACE programs solve the dilemma by allowing municipalities to offer upfront cash for energy efficiency improvements and on- site renewable energy to home- and businesses-owners, and allowing them to pay back their loans via their property tax bills. Long-term loans make more substantial projects with higher energy savings possible, and using the property tax bill allows payments to carry over to future beneficiaries of the energy improvements.
PACE can also place cities at the center of energy decisions for their community, making them a hub for information about and resources for saving energy dollars and creating jobs for energy improvements.
 30 states have enacted laws allowing municipalities to create PACE programs, covering 80% of the U.S. population, but programs have been relatively slow to grow.
In May 2010, four active PACE programs had served over 2,000 properties with total financing just over $37 million. By mid-2013, PACE programs had collectively financed hundreds of millions of dollars in residential and commercial retrofits.83,84
Despite the sound concept and growing success, a major barrier to expanding PACE is the Federal Housing Finance Agency (FHFA). It issued a statement in July 2010 arguing that PACE liens – which have higher priority for repayment in the event of bankruptcy – threatened the financial security of mortgage holders. FHFA is wrong: default rates on energy efficiency loans are low and the likely exposure of credit holders is less than $200 per home.85 In fact, owners of energy efficiency properties are less likely to default than those whose homes are less efficient.86 That the data suggests otherwise hasn’t caused the FHFA to repent, and their stance has brought the growth of PACE for residential property to a virtual standstill, although as we will see, several communities defiantly continue to successfully operate such programs.87
The credit crisis in late 2008 also hasn’t done PACE any favors, with banks wary to try a new form of financing home and business energy improvements despite the proven low risk.
In spite of the threat from FHFA and the credit crisis, several communities – particularly those with programs predating the FHFA ruling – have operated very successful residential PACE programs.
Commercial PACE programs, unaffected by the FHFA ruling, have ramped up.
The major recent shift in PACE programs is that several larger financiers (e.g. Ygrene, Figtree, Renovate America, Renewable Funding) have emerged to offer full-service programs to municipalities wary of running their own program. Repayment of financing still uses the property tax bill, but the private companies, not the cities, provide initial financing. It’s likely that such public- private partnerships will help many cities overcome their reluctance to establish local financing programs, at the expense of having the city be the local hub for improving its energy future.
Sonoma County, CA
The Energy Independence Program of Sonoma County launched in 2009 using general fund dollars and revenue bonds to finance on-site renewable energy and energy efficiency projects for residential and commercial properties. By early 2010, the program had provided $21 million to finance 670 energy retrofits at a 7% fixed interest rate.88
The county responded to the FHFA statement with a lawsuit, and it continued a residential retrofit program, providing extensive disclosure to customers of the risks posed by the FHFA threat.
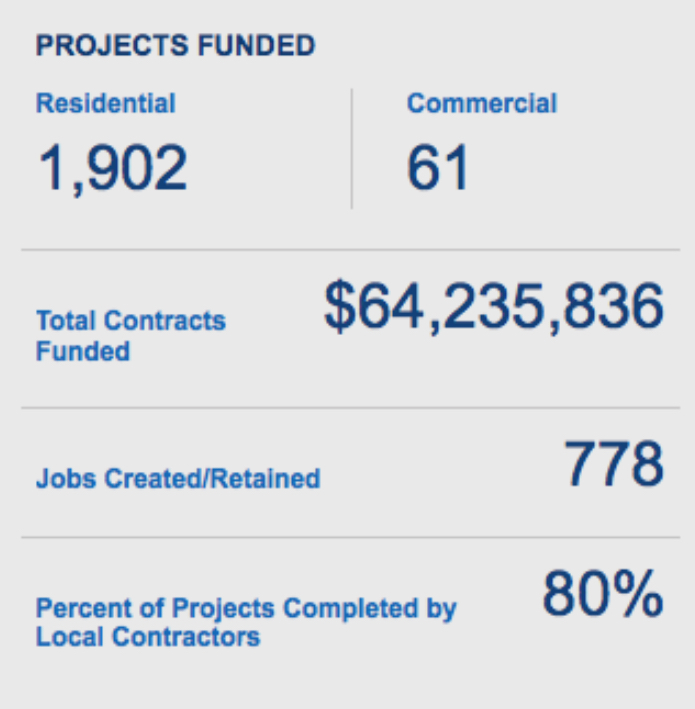
By July 2012, total financing through the program reached $57 million (51 commercial projects and over 1,600 residential ones89).90 In August 2013, Sonoma County’s PACE program reported $63.6 million in financing for 60 commercial and nearly 1,900 residential projects (0.92% of housing units).91
Palm Desert, CA
Another California town, Palm Desert, also launched its Energy Independence program in 2008, with $5 million from its general fund and redevelopment agency. The program was expanded with an additional $6 million in 2010, shortly before the FHFA decision was handed down.
The Palm Desert program was briefly suspended, but like Sonoma County, it resumed the residential retrofit program and continued to offer a modest commercial PACE program.
By mid-2010, the program had financed improvements on 4 commercial and 216 residential properties at 7% interest.92 By mid-2013, the city had completed projects on 336 properties (mostly residential) and provided $6.5 million in financing. Completed residential projects account for nearly 1% of the city’s 37,000 residential properties.
California legislation passed since the program began allows for greater aggregation of PACE programs (among multiple municipalities). Palm Desert will likely suspend their independent PACE program and join one of the large aggregations by the end of 2013.93 The larger programs will presumably provide lower administrative costs and be able to get lower interest rates by selling bonds to finance improvements in larger increments.
Babylon, NY
The Long Island Green Homes program was one of the first PACE programs when it launched in 2008 and remains one of the most successful. By December 2011, the program had financed retrofits of 1% of the homes in the community.94,95
As of August 2013, the program had resulted in over 1,100 retrofits – nearly 2% of residential properties in the city – with an average annual energy savings of $1,300.96
The genius behind Babylon’s program was the source of financing. The town had a reserve of $25 million in its solid waste fund due to reducing waste with recycling. An amendment to the Solid Waste Code adding carbon as a waste allowed the city to tap into its reserve to finance energy efficiency improvements that reduced carbon waste. Residents were able to “borrow” money from the city at 3% interest for substantial energy efficiency improvements, a much lower rate than in other cities. The low interest rate likely explains why Babylon’s PACE program has the highest participation rate (2% of residential properties) of any residential program.
For More Information
- Guide to Energy Efficiency and Renewable Energy Financing Districts (UC Berkeley, 2009)97
- Municipal Energy Financing: Lessons Learned (ILSR, 2010)98
- PACE: An Overview, Update, and the Future [presentation] (ILSR, 2010)99
- PACE 101100
- PACENOW list of active and forthcoming programs101
The Limits of Local Authority
The cities highlighted in this report represent leaders on local energy policy, but it would be unfair not to mention that many cities simply lack the authority to adopt many of these leading rules.
While the federal constitution typically reserves all powers not expressly given the federal government to the states, states typically do not similarly reserve powers for cities. In fact, an opinion issued by Justice Dillon of the Iowa Supreme Court in the mid-1800s (Clark v. City of Des Moines) set a precedent for local authority that extends to this day in most states:
It is a general and undisputed proposition of law that a municipal corporation possesses and can exercise the following powers and no others: First, those granted in express words; second, those necessarily or fairly implied in or incident to the powers expressly granted; third, those essential to the declared objects and purposes of the corporation, not simply convenient, but indispensable. Any fair, reasonable doubt concerning the existence of the power is resolved by the courts against the corporation, and the power is denied.102
In other words, many cities have only those powers expressly granted them by the state or that are indispensable in being a city. Issues like energy codes or property assessed clean energy programs don’t fit under “Dillon’s Rule.”
On the other hand, many states have instituted a form of “home rule,” that grants powers of self-governance to cities. Home rule is still not like being a state because the state may still draw limits around the authority of home rule municipalities, but it does offer cities more leeway in setting local policy. In some cases, like Building Codes, it allows communities to go beyond the standards set (or left blank) in state law. In others, like PACE programs or Community Choice, the state still has to expressly grant the authority to municipalities. Home rule authority may only apply to certain cities in a state (those that have a local charter, for example) and the level of local authority varies significantly (some municipalities have no local taxing authority, for example, while others have broad powers).
The included map provides a basic overview of the level of local authority in each state. States with home rule grant any municipality at least some level of local authority. States with Dillon’s rule have minimal local authority. States with both tend to offer more authority to certain cities, while others have Dillon’s limited scope of power. A couple states have neither.
Summary
This report highlights eight powerful strategies cities have adopted to boost clean energy and their economies. These communities are just the tip of the iceberg in a sea of cities finding new and innovative ways to keep their economy humming using their own resources and authority. We welcome information from readers on models they’ve seen.
Chattanooga, TN, shows how a municipal utility can improve its service and expand its focus to save its customers millions of dollars and provide essential services for the 21st century economy. Sonoma County, CA, shows how a local government can make a dent in energy use (and greenhouse gas emissions) and boost local hiring, without owning its own utility. Babylon, NY, shows that existing revenue streams can be repurposed in ways that save citizens on their energy bills, repays the city, and stems the flow of energy dollars out of a community.
Not every community can use every power. Around 2,000 communities get their power from municipally-controlled utility, but many don’t. Cities can change building codes in many states, but many more cannot. 30 states give cities the authority to establish local financing programs for energy efficiency and clean energy, but 20 do not.
But every community has the power to do something to improve its economic future without relying on rules or money from the state or federal government. Every community can do more than it does. And every community stands to do better if it explores the extent of its authority to create jobs with local clean energy policies.
Footnotes
- City of Boulder staff. Study Session: Boulder’s Climate Commitment, Energy Efficiency Programs and Market Innovation Program Update. (7/30/2013). Accessed 8/30/2013 at https://tinyurl.com/oo3v3kv.
- Johnson, Rebecca. Municipal Electric Utilities – Analysis and Case Studies. (July 2006).
- SMUD did not start delivering power until 1946, due to a long legal battle with incumbent electric company, Pacific Gas & Electric.
- Wikipedia contributors. Sacramento Municipal Utility District. (Wikipedia, The Free Encyclopedia, 6/7/2013). Accessed 8/6/2013 at https://tinyurl.com/khv8ot7.
- Aitken, Donald W. SMUD PV Program Review. (SMUD Consulting Services Contract No. I-143, 12/30/2000). Accessed 9/20/2013 at https://tinyurl.com/kxvdgy7.
- Ibid.
- Barbose, Galen, et al. Tracking the Sun III. (Lawrence Berkeley National Laboratory, December 2010), 13. Also, Solar Industry Data. (Solar Energy Industries Association, undated). Accessed 9/26/2013 at https://tinyurl.com/ d9734l8.
- Climate Change. (SMUD, undated). Accessed 9/19/2013 at https://tinyurl.com/ofn8hq7.
- Weiser, Mat.. 20 Years After Sacramento Voted to Shut Rancho Seco, SMUD Has Diversified Energy Sources. (Nukefree.org from Sacramento Bee, 6/7/2009). Accessed 9/19/2013 at https://tinyurl.com/o9h39ga.
- EIA, 2011.
- Board of Directors’ Meeting Agenda. (SMUD, 4/18/2013). Accessed 9/20/2013 at https://tinyurl.com/m78mqu5.
- Farrell, John. U.S. CLEAN Programs: where Are We Now? What Have We Learned? (Institute for Local Self-Reliance, June 2012). Accessed 9/4/2013 at https://tinyurl.com/lv4pfj5.
- Clean Air Policy. (SMUD, undated). Accessed 9/19/2013 at https://tinyurl.com/olb5dth. And Plug-in Electric Vehicle Program Information. (SMUD, 11/9/2010). Accessed 9/20/2013 at https://tinyurl.com/mqvbfpm.
- Benefit Analysis of Energy Storage: Case Study with Sacramento Municipal Utility District. (Electric Power Research Institute, 2011). Accessed 8/27/2013 at https://tinyurl.com/ka2s9w3.
- Kempton, Willett and Cliff Murley. Modeling V2G for a Utility with a High Wind Generation Portfolio. (Presented to Zero Emission Vehicle Technology Symposium Session: “Electric Fueling Infrastructure” California Air Resources Board. Sacramento, CA. September 26, 2006.) Accessed 9/4/2013 at https://tinyurl.com/knrbdqw.
- Austin Energy Annual Performance Report, 2012. (7/26/2013). Accessed 9/23/2013 at https://tinyurl.com/mxj9qft.
- The Green Building program rates buildings for their energy savings above the existing energy code.
- Aitken, Donald W. Also, Austin Energy Annual Performance Report, 2012. (7/26/2013). Accessed 9/23/2013 at https://tinyurl.com/mxj9qft.
- Austin Energy – Residential Energy Efficiency Loan Program. (DSIRE, 2/14/2013). Accessed 9/4/2013 at https:// tinyurl.com/mocyfwe.
- Knapp, don. Aspen, Bellingham, and Austin Honored for Energy Efficiency Innovation. (ICLEI USA, 9/28/2010). Accessed 9/4/2013 at https://tinyurl.com/koxvxqr.
- Austin Energy Annual Performance Report, 2012.
- M.J. Bradley & Associates, LLC. Benchmarking Electric Utility Energy Efficiency Portfolios in the U.S. (Ceres, November 2011). Accessed 9/4/2013 at https://tinyurl.com/m9kfrwr.
- Austin Energy Annual Performance Report, 2012.
- Palo Alto City Manager. Memo to City Council Finance Committee, “Utilities Advisory Commission Recommendation to Approve the Proposed Long-Term Electric Acquisition Plan (LEAP) Objectives, Strategy and Implementation Plan. (12/7/2010). Accessed 9/23/2013 at https://tinyurl.com/m2ly433.
- Browning, Adam. Palo Alto Municipal Utility: Going big on solar. (Vote Solar blog, 6/19/2013). Accessed 9/10/2013 at https://tinyurl.com/q33wt8j.
- Palo Alto Green celebrates 10 years of electrifying change! (City of Palo Alto, 9/13/2013). Accessed 9/23/2013 at https:// tinyurl.com/md75s76.
- Palo Alto City Manager.
- City of Palo Alto Utilities Demand Side Management Program. (December 2012). Accessed 9/23/2013 at https://tinyurl.com/lozw64f.
- Utilities Advisory Commission minutes. (4/7/2010). Accessed 9/23/2013 at https://tinyurl.com/mvepsjd.
- Stack, Jim, et al. Palo Alto: Going Carbon Neutral by Going Big on Solar. (Presentation for Vote Solar webinar, 7/27/2013). Accessed 9/10/2013 at https://tinyurl.com/nlbewg3.
- Mitchell, Chris. Broadband at the Speed of Light. (Institute for Local Self-Reliance, April 2012), 43. Accessed 9.4.2013 at https://tinyurl.com/lvrrrxj.
- Tweed, Katherine and Ben Kellison. Smart Grid Spat in Chattanooga Reveals Grid Myths and Value. (GreenTechMedia, 8/6/2013). Accessed 9/4/2013 at https://tinyurl.com/m5qlshy.
- Berkowitz, Avrahmi. Municipal Broadband: What Chattanooga Has That New York Doesn’t. (Commercial Observer, 7/17/2013). Accessed 9/24/2013 at https://tinyurl.com/oq36e7x.
- Tweed, Katherine. Smart Grid Saves EPB Chattanooga $1.4M in One Storm. (GreenTech Media, 10/17/2012). Accessed 9/4/2013 at https://tinyurl.com/k29scrm.
- Mitchell, 43.
- Mitchell, 40.
- Mitchell, 38-40.
- Mitchell, 43.
- More information available from the Local Energy Aggregation Network: https://www.leanenergyus.org/cca-resources/.
- Farrell, John. Community Choice Aggregation An Update. (Institute for Local Self-Reliance, June 2009). Accessed 9/11/2013 at https://ilsr.org/community-choice-aggregation-update/.
- Marin County CCA ordinance: Accessed 9/24/2013 at https://tinyurl.com/lhg7jy7.
- Marin Energy Authority Energy Efficiency Program for 2013-2014. (Marin Energy Authority, revised 5/7/2013). Accessed 9/18/2013 at https://tinyurl.com/oy4b6qg.
- Power Sources. (Marin Clean Energy, 2013). Accessed 9/11/2013 at https://tinyurl.com/ow43tsx/.
- Local Renewable Energy. (Marin Clean Energy, 2013). Accessed 9/11/2013 at https://tinyurl.com/pwocokf.
- Cora, Casey. With Voter OK, Oak Park Pursues Electricity Aggregation. (OakPark-RiverForest Patch, 4/11/2011). Accessed 9/24/2013 at https://tinyurl.com/kfl7nke/.
- CCAs in Illinois. (Local Energy Aggregation Network, 2013). Accessed 9/11/2013 at https://tinyurl.com/ppchnb7.
- San Francisco CCA ordinance: Accessed 9/24/2013 at https://tinyurl.com/ny85elg.
- Roberts, Chris. CleanPowerSF to rely on green credits, not actual renewable energy sources. (SF Examiner, 6/4/2013). Accessed 9/11/2013 at https://tinyurl.com/mf7e9ch.
- Riley, Neal. PUC fails to set rates for CleanPowerSF. (San Francisco Chronicle, 8/14/2013). Accessed 9/11/2013 at https://tinyurl.com/oma6lt8.
- Sabatini, Joshua. Mayor blasts CleanPowerSF as program funding could go to Rim Fire repairs. (SF Examiner, 9/11/2013). Accessed 9/24/2013 at https://tinyurl.com/lexmkwb.
- CCAs in California. (Local Energy Aggregation Network, 2013). Accessed 9/11/2013 at https://tinyurl.com/q9frrzu.
- Community Choice Aggregation Implementation Plan and Statement of Intent. (Sonoma Clean Power, August 2013). Accessed 9/24/2013 at https://tinyurl.com/mgs7djf.
- Lydersen, Kari. Municipal aggregation: a new direction or the same old thing? (Midwest Energy News, 12/17/2012). Accessed 9/11/2013 at https://tinyurl.com/plvxvln.
- Status of State Energy Code Adoption. (DOE, 2013). Accessed 8/9/2013 at https://tinyurl.com/dy8ac56.
- Ibid.
- Alabama and Colorado have a state code for state-owned buildings. Codes for private buildings are set at the local level. Also Code Adoption Process by State. (International Code Council, December 2012). Accessed 9/30/2013 at https://tinyurl.com/m7fuo5h.
- National Energy and Cost Savings for New Single – and Multifamily Homes: A Comparison of the 2006, 2009, and 2012 Editions of the IECC. (U.S. Department of Energy, April 2012). Accessed 9/10/2013 at https://tinyurl.com/mls8pxw.
- Lacey, Stephen. Are Efficiency Advocates and Home Builders Finally Seeing Eye to Eye? (GreenTech Media, 9/3/2013). Accessed 9/10/2013 at https://tinyurl.com/qc9fggq.
- Code Compliance. (Institute for Market Transformation, undated). Accessed 9/10/2013 at https://tinyurl.com/pk44x4v.
- Code Compliance Savings Potential. (IMT). Accessed 9/30/2013 at https://tinyurl.com/mavsmx7.
- Austin energy code: https://www.cityofaustin.org/edims/document.cfm?id=191501.
- Boulder County energy code: https://www.bouldercounty.org/property/build/pages/buildingamends.aspx.
- Babylon energy code: https://ecode360.com/6806012?highlight=energy#6806012.
- Seattle energy code: https://www.seattle.gov/dpd/codesrules/codes/energy/overview/.
- Massachusetts Stretch Code: Appendix 120AA (Massachusetts 2009). (DOE Building Energy Codes Program, 2012). Accessed 8/14/2013 at https://tinyurl.com/mvep6fn.
- Santa Monica energy code: https://www.smgov.net/Departments/OSE/Categories/Green_Building/Code_Requirements.aspx.
- Marin County energy code: https://www.dsireusa.org/incentives/incentive.cfm?Incentive_Code=CA40R.
- Your CAP Tax Dollars at Work. (City of Boulder, undated). Accessed 8/30/2013 at https://cl.ly/2b3C1n0d342f.
- Chapter 3-12: Climate Action Plan Excise Tax. (Boulder City Code, 2013). Accessed 8/30/2013 at https://tinyurl.com/qht5rww.
- Chapter 133: Solid Waste Management. Article I: Definitions. Accessed 8/30/2013 at https://ecode360.com/6807556.
- Ibid.
- Lancaster solar ordinance: https://www.cityoflancasterca.org/Modules/ShowDocument.aspx?documentid=19858.
- Trabish, Herman K. Lancaster, CA Becomes First US City to Require Solar. (GreenTech Media, 3,27,2013). Accessed 8/20/2013 at https://tinyurl.com/l7rlf85.
- Barringer, Felicity. With Help From Nature, a Town Aims to Be a Solar Capital. (New York Times, 4/8/2013). Accessed 8/20/2013 at https://tinyurl.com/cegj86c.
- Caudle, Jason. Staff Report, City of Lancaster, Lancaster Power Authority. (Memo dated 11/8/2011). Accessed 9/10/2013 at https://tinyurl.com/pcs9t2f.
- Green Miranda. California Towns Pass Law Requiring New Buildings to Have Solar Panels. (The Daily Beast, 5/10/2013). Accessed 8/20/2013 at https://tinyurl.com/lj8d38w. Also Ordinance link: https://cl.ly/2b3C1n0d342f.
- Policy Map. (Building Rating.org, 2013). Accessed 8/12/2013 at https://tinyurl.com/kt4ghg2.
- Energy and Environmental Advocacy: Frequently Asked Questions. (Montgomery County, 2013). Accessed 8/12/2013 at https://tinyurl.com/m7xqcen.
- Comparison of U.S. Commercial Building Energy Rating and Disclosure Policies. (Institute for Market Transformation and BuildingRating.org, 2012). Accessed 8/12/2013 at https://tinyurl.com/m3zank8.
- Comparison of U.S. Commercial Building Energy Rating and Disclosure Policies. (Institute for Market Transformation and BuildingRating.org, 2012). Accessed 8/12/2013 at https://tinyurl.com/m3zank8. Also, Tweed, Katherine. Energy Benchmarking Picks Up Steam in the US. (GreenTech Media, 5/23/2011). Accessed 8/12/2013 at https://tinyurl.com/lkv24fb. Also, Commercial building energy rating and disclosure ordinance: FAQ. (City of Minneapolis, undated). Accessed 8/12/13 at https://tinyurl.com/ka68x2q. Also, Frye, Minot and Rob Watson. Boston becomes latest city to order building energy benchmarking. (GreenBiz.com, 5/13/13). Accessed 8/12/13 at https://tinyurl.com/l2etx5y.
- Hill, Alex and Philippe Dunsky. Building Energy Rating and Disclosure Policies Update and Lessons from the Field. (Northeast Energy Efficiency Partnerships, February 2013). Accessed 9/12/2013 at https://tinyurl.com/lh7jyhm.
- Ibid.
- Annual Report. (PACENow, June 2013). Accessed 8/9/2013 at https://tinyurl.com/mbat4yr.
- Andrew. Riverside County’s Property Assessed Clean Energy Program Tops $100M, Goes Statewide. (CleanTechnica, 2/1/2013). Accessed 8/26/2013 at https://tinyurl.com/m54ubbl.
- Hayes, Sara, et al. What Have We Learned From Energy Efficiency Financing Programs? (American Council for an Energy-Efficient Economy, September 2011). Accessed 8/26/2013 at https://tinyurl.com/luauhfd. Also, Woody, Todd. Analysis: Energy Lien is Little Threat to Loan Giants. (New York Times, 7/2/2010). Accessed 8/26/2013 at https://tinyurl.com/3xm4mbe.
- Home Energy Efficiency and Mortgage Risks. (Institute for Market Transformation, March 2013). Accessed 8/26/2013 at https://tinyurl.com/mcwbmqb.
- Farrell, John. FHFA Finally Releases PACE Ruling: Did They Repent? (ILSR, 7/15/2012). Accessed 8/26/2013 at https://tinyurl.com/ky77vsa.
- Farrell, John. Municipal Energy Financing: Lessons Learned. (ILSR, May 2010). Accessed 8/23/2013 at https://tinyurl.com/kpsbxkx.
- Municipal Webinar 3: Sonoma County’s Commercial PACE Program Questions and Answers. (PACENow/EIP, February 2012). Accessed 8/23/2013 at https://tinyurl.com/k6l3v9e.
- Sonoma County – Energy Independence Program. (DSIRE, 8/14/2012). Accessed 8/23/2013 at https://tinyurl.com/n2unaks.
- PACE Financing. (Sonoma County, 2013). Accessed 8/29/2013 at https://tinyurl.com/qbgx8hq.
- Case Study: Palm Desert, CA. (Home Performance Resource Center, March 2010). Accessed 8/3/2013 at https://tinyurl.com/ln3yyov.
- Alvarez, Martin. City of Palm Desert Staff Report. (5/23/2013). Accessed 8/23/2013 at https://tinyurl.com/kfuhanl.
- Ragimova, Rena. Long Island Green Homes in Babylon, NY. (ICLEI, September 2009). Accessed 8/23/2013 at https://tinyurl.com/mc3urbn.
- Long Island Green Homes, https://www.longislandgreenhomes.org/.
- 8/19/2013 Program Update. (Long Island Green Homes). Received via email from Director of Sustainability and Chief Recovery Officer for Suffolk County, 8/26/2013.
- Guide to Energy Efficiency and Renewable Energy Financing Districts for Local Governments (City of Berkeley, September 2009). Accessed 9/24/2013 at https://tinyurl.com/lhdoa3w.
- Farrell. Municipal Energy Financing: Lessons Learned.
- Farrell. Municipal Energy Financing: Lessons Learned.
- PACE 101. (One Block Off the Grid, 2/25/2010). Accessed 9/23/2013 at https://www.youtube.com/watch?v=qqg9wYkjNAM.
- https://pacenow.org/pace-programs/.
- Dillon first set out the rule that would later bear his name in Clark v. City of Des Moines (1865) (Richardson, et al. 2003).
- Sources include Wikipediam Ballotpedia, National League of Cities, Alaska Department of Community and Economic Development, Minnesota League of Cities, Mississippi Association of County Board Attorneys, Diane Lang (The Municipal Reporter), Municipal Associate of South Carolina, Strom Thurmond Institute of Government and Public Affairs Clemson University, Tooele City (UT).
![]()
![]()
![]()
![]()