Before the holidays we posted a chart illustrating the average cost of solar by state, highlighting Minnesota’s claim to the most expensive solar PV in the nation. The data came from the brilliant report, Tracking the Sun III: The Installed Cost of Photovoltaics in the U.S. from 1998-2009 (large pdf).
But are solar costs high in some states simply because the market is small? The answer seems to be no.
The following chart illustrates the average cost of solar PV by state, mapped against the total installed capacity (in megawatts) from 2007-09. California is omitted because its 1600 MW of new capacity dwarfs other state markets; Colorado, Hawaii, and North Carolina were not included in the original dataset. The markers for Oregon and Connecticut were shaded blue and red, respectively, to help distinguish them from surrounding states.
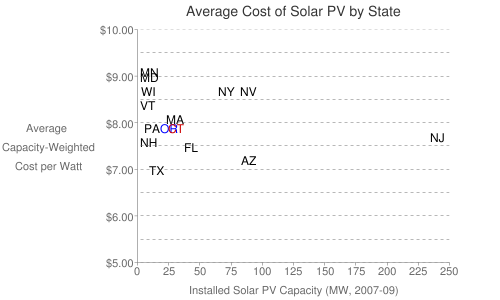
What’s clear from the data is that there seems to be little relationship between market size and average installed costs. Texas installed 16 MW at an average cost of $7.00 over the three years analyzed, whereas New York and Nevada had costs 25% higher in markets five times the size. And five states with markets 10 MW and smaller had costs ranging from $7.60 (New Hampshire) to $9.10 per Watt (Minnesota). The largest markets in New Jersey and California tie for 5th lowest cost, 10% more expensive than the least expensive market despite being (in California’s case) two orders of magnitude larger.
The data leave a lot of questions. Why don’t larger markets uniformly have lower prices? Why is there such large variation in costs in smaller solar market states? And how does state solar policy matter, when there is no correlation between the total value of state incentives and the before-incentive installed cost of solar?
Update 1/20/11: a cacophony of different permitting rules may be partially responsible. The solar industry estimates that permitting costs add $2,500 to each solar installation.