By Stacy Mitchell and Walter Wuthmann
This piece first appeared at Grist.
At Walmart’s annual meeting on Friday, shareholders will vote on a measure that would force the company to reckon with one of the biggest — and best hidden — sources of climate pollution in its vast global operations: shipping.
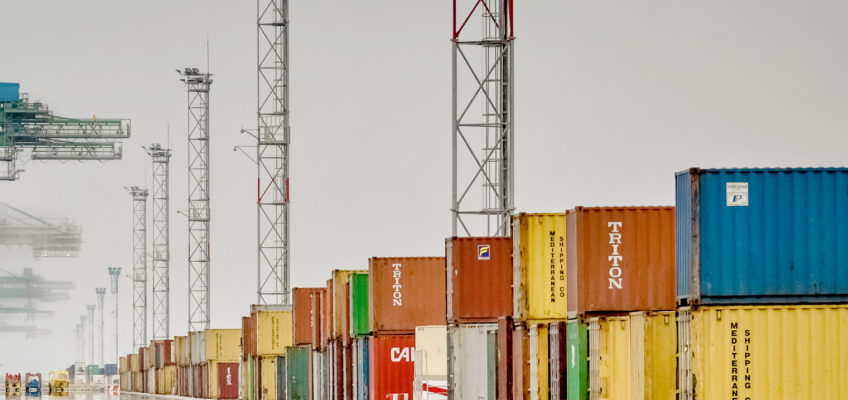
No company moves as much stuff across the world’s oceans as Walmart does. The climate consequences are immense. Ferrying all those cheap TVs, T-shirts, toasters, and toys from Asian factories to ports in the U.S. and elsewhere releases huge amounts of greenhouse pollutants into the atmosphere, including both carbon dioxide (CO2) and black carbon, a kind of soot whose climate impacts are less well-understood that those of CO2, but almost certainly just as menacing.
A decade ago, Walmart began promoting itself as a sustainability leader. And, yet, in all the years since, the company has been silent about the environmental impacts of its massive shipping operations. It’s as though this core part of its business doesn’t exist. In fact, when Walmart reports its greenhouse gas emissions each year, it omits the pollution generated by shipping.
That could change on Friday. Shareholders will consider a resolution that would require the company’s management to report greenhouse gas emissions from shipping and take concrete steps to reduce them, as other larger retailers have done. The resolution was proposed by Mary Pat Tifft, a member of Our Walmart, a growing organization of Walmart employees that has won significant improvements in the company’s labor practices and is increasingly focusing on its environmental impact.
To provide context for this important resolution, we’ve compiled a few key data points on shipping’s climate impact and Walmart’s dominance in the movement of goods across the world’s oceans:
3 — Percentage of human-made CO2 currently emitted from global shipping.
18 — Estimated percentage of human-made CO2 that will be emitted from global shipping in 2050, in a business-as-usual scenario.
1 — Walmart’s rank in the list of top U.S. importers of goods shipped by sea.
291,900 — Number of standard shipping containers imported by Walmart in 2002.
731,500 — Number of containers imported by Walmart in 2013.
11 — Number of Great Pyramids of Giza that could be constructed from Walmart’s 2013 container imports.
8 — Rank of the head of the Panama Canal Authority on a list of the most powerful people in container shipping.
5 — Rank of Walmart CEO Doug McMillon on this list.
760 million — Number of cars it would take to generate as much sulfur pollution as is emitted by the world’s 15 largest container ships.
254 million — Number of cars registered in the U.S.
$5.2 billion — Amount being spent to expand the Panama Canal, doubling the capacity of cargo that can travel from Asia to the eastern half of the U.S.
4.2 million — Square footage of Walmart’s largest import distribution center, located on the Gulf Coast in Texas.
2.5 — Number of cents it costs to ship a sweater 3,000 miles by sea.
2.2 million — Pounds of black carbon (soot) emitted by marine shipping each year.
2 — Rank of black carbon on the list of top contributing agents to global warming.
60,000 — Annual number of U.S. deaths attributed to black carbon from marine shipping.
2005 — Year in which Walmart’s then-CEO Lee Scott said, “We believe every company has a responsibility to reduce greenhouse gases as quickly as it can.”
14 — Percentage increase since 2005 in Walmart’s self-reported greenhouse house gas emissions.
0 — Share of CO2 produced by Walmart’s global shipping that the company includes in those self-reported figures.
0 — Number of times Walmart’s 134-page 2015 Global Responsibility Report mentions the company’s global shipping operations.
—
[i] International Maritime Organization, “Third IMO GHG Study 2014.”
[ii] International Maritime Organization, “Second IMO GHG Study 2009.”
[iii] “Top 100 Importers in 2013: U.S. Foreign Trade via Ocean Container Transport,” Journal of Commerce.
[iv] “Top 100 Importers in 2002,” Journal of Commerce.
[v] “Top 100 Importers in 2013: U.S. Foreign Trade via Ocean Container Transport,” Journal of Commerce.
[vi] One TEU is 39 cubic meters. The Pyramid of Giza is 2.5 million cubic meters. The total volume of Walmart’s 2013 container imports could also fill 27 Empire State Buildings.
[vii] “The 20 most powerful people in container shipping,” Lloyd’s List, 19 Feb 2015.
[viii] “The 20 most powerful people in container shipping,” Lloyd’s List, 19 Feb 2015.
[ix] John Vidal, “Health Risks of Shipping Pollution Have Been ‘Underestimated’,” Guardian, 9 Apr 2009.
[x] “U.S. vehicle registrations 1990-2012,” Statista.
[xi] “Panama Canal Expansion Facts and Figures,” World Maritime News, 30 Oct 2014.
[xii] Katherine Feser, “Deal of the Week: Huge industrial park sells,” Houston Chronicle, 13 Dec 2014.
[xiii] Rose George, “Container shipping: the secretive industry crucial to our existence,” Telegraph, 6 Sep 2013.
[xiv] “Maritime Shipping Makes Hefty Contribution to Harmful Air Pollution,” National Oceanic and Atmospheric Administration, 26 Feb 2009.
[xv] Tami C. Bond and Haolin Sun, “Can Reducing Black Carbon Emissions Counteract Global Warming?,” Environmental Science & Technology, 39: 5921-5926, 2005.
[xvi] Vidal, “Health Risks of Shipping Pollution,” Guardian, 2009.
[xvii] “Twenty First Century Leadership,” speech presented by Lee Scott, 24 Oct 2005.
[xviii] CDP 2012 Information Request: Wal-Mart Stores, Inc.
[xix] CDP 2012 Information Request: Wal-Mart Stores, Inc.
[xx] Walmart, 2015 Global Responsibility Report.
Photo by Tristan Taussac.


