![]() According to newly released data from the U. S. Economic Census, overall sales at independent retailers grew by about 4 percent, after adjusting for inflation, between 2002 and 2007.
According to newly released data from the U. S. Economic Census, overall sales at independent retailers grew by about 4 percent, after adjusting for inflation, between 2002 and 2007.
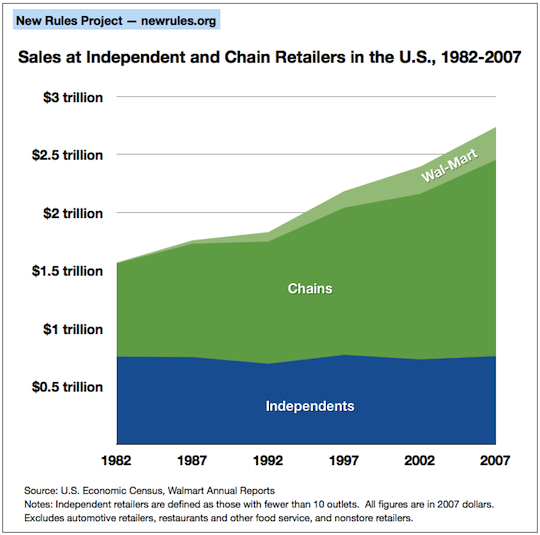
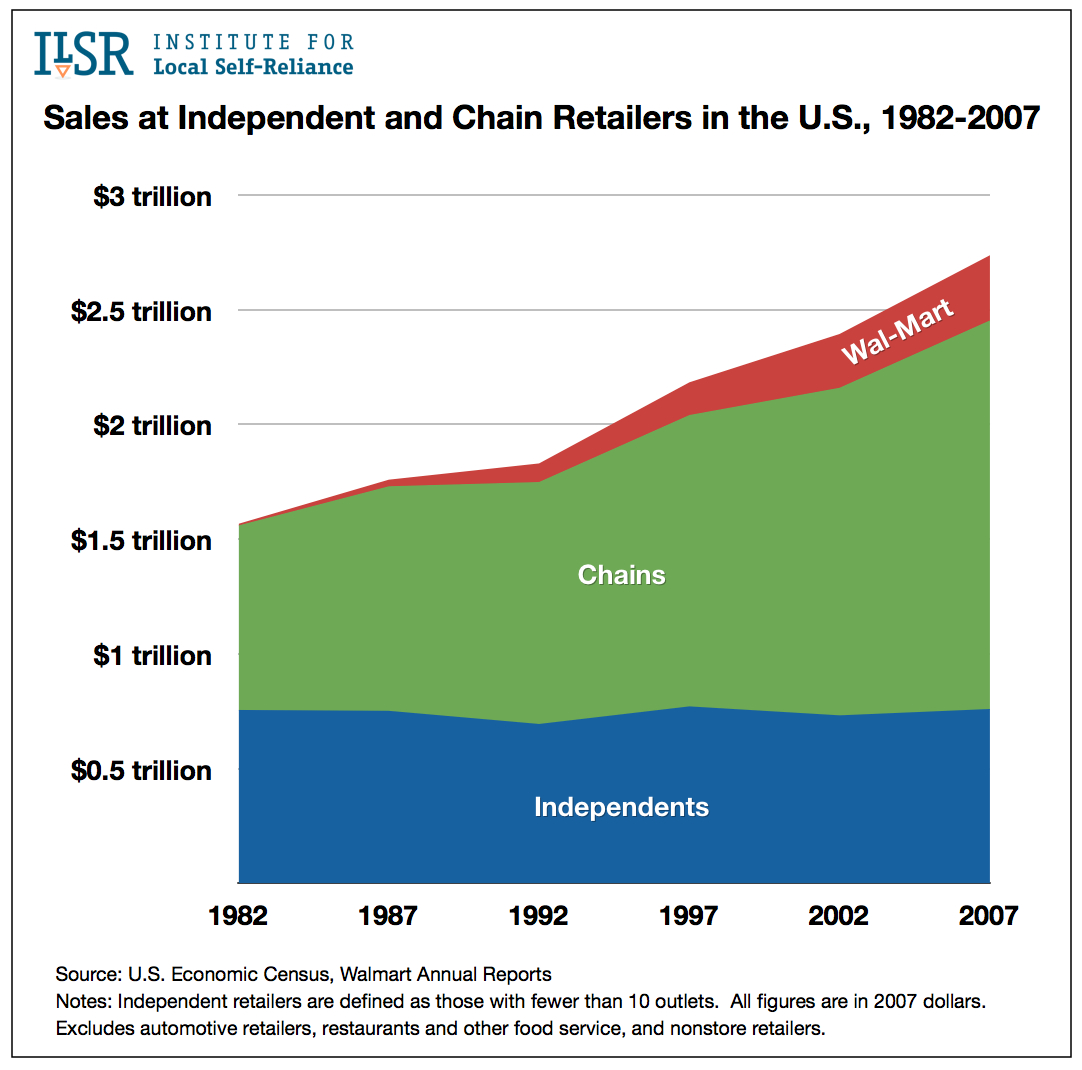
The bad news is that chains grew faster and independents still lost market share, falling from 31 to 28 percent of consumer retail spending. This decline in market share, however, was considerably slower in this five-year period, compared with the preceding 20 years, in which independents lost ground at a faster rate. In 1982, independent retailers captured nearly half of all retail spending.
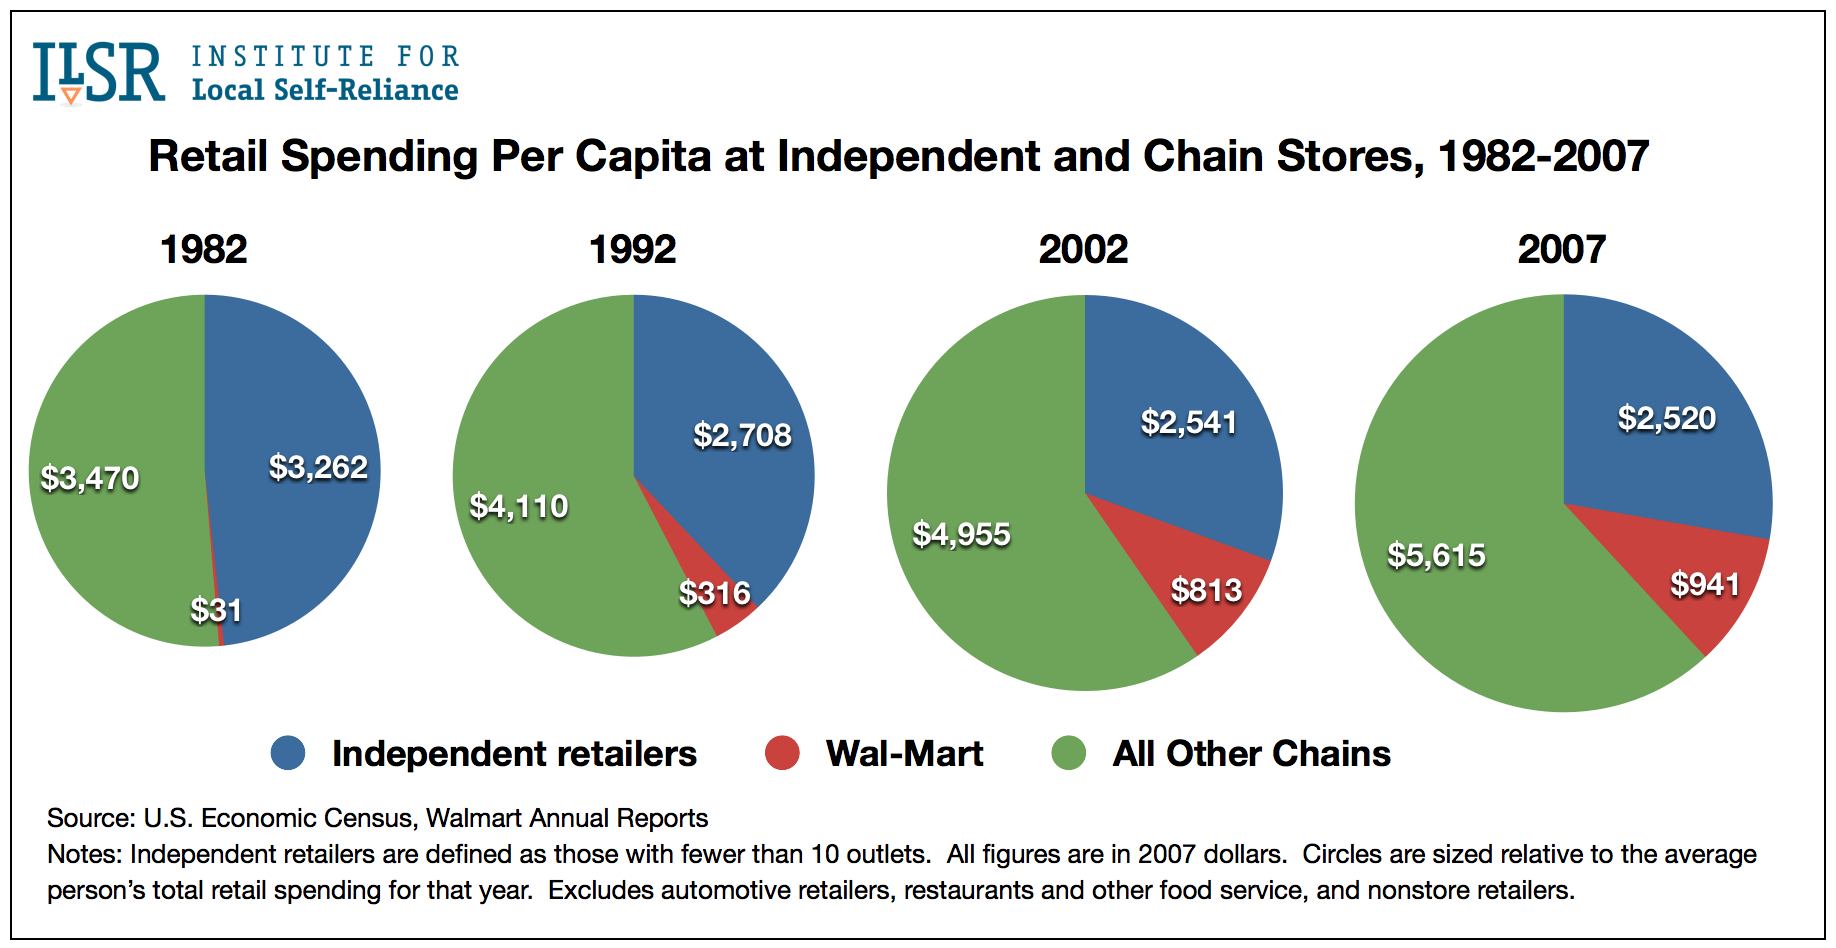
 In 2007, Americans spent an average of $2,520 at independent retailers, $941 at Wal-Mart, and $5,615 at other chains. Here’s how that’s changed over time:
The U. S. Economic Census is conducted every five years. The resulting data are released in batches two to four years later. For this analysis, the New Rules Project defines independent retailers as those with fewer than 10 outlets.
Because the 2007 Census preceded the current recession, the downturn’s impact on both independents and chains will not be evident until the 2012 Census.
Here are a few other highlights from the new data:
- The number of retail firms in every employment size category declined, except for the smallest firms, those with fewer than 5 employees. Their numbers grew by 10,453. Firms in this size category also recorded a modest increase in their revenue and market share.
- Perhaps most remarkable has been the growth of specialty food stores, such as bakeries and greengrocers. The Census showed a net gain of over 1,400 small specialty food retailers (those with fewer than 20 employees). Sales at these stores shot up 23 percent even as grocery sales overall grew just 3 percent. This trend likely reflects increased public interest in locally produced foods, as well as a growing desire to shop at neighborhood stores.
- Employees of independent retailers earned more per year than employees of national chains (an average of $27,451 vs. $20,313). Whether this reflects a higher hourly rate or more hours worked is not discernable from the data. (A similar pay gap shows up in the 2002 data as well.)
- The number of independent supermarkets remained relatively unchanged at 40,000, although revenue slipped by about 4 percent.
- The number of independent hardware stores fell by 854, but the remaining 12,122 increased their sales enough that overall revenue at independent hardware stores held steady.
- The U. S. recorded a net gain of independent retailers in several categories, including 870 new clothing stores, 425 fabric and sewing stores, 352 pet supply stores, and 549 office supply and stationery stores.
- Among harder hit categories, the number of independent camera and photo supply stores fell by about one-third, though the remaining stores saw revenue growth of about 13 percent.
- Independent florists declined by 2,800 and lost 19 percent of their sales, as more people purchased flowers at supermarkets and big-box stores.
As of 2007, the U. S. counted the following independent retailers: approximately 60,000 grocery and specialty food stores, 38,000 clothing shops, 19,000 florists, 18,000 pharmacies, 18,000 furniture stores, 17,000 sporting goods retailers, 12,000 hardware stores, 12,000 nurseries and garden centers, 7,400 appliance stores, 6,400 shoe stores, and 2,700 general bookstores.