
![]()
 There are a lot of stories on residential rooftop solar but few if any on what cities are doing to make themselves energy self-reliant by using their own buildings and lands to generate power.
In Public Rooftop Revolution, ILSR estimates that mid-sized cities could install as much as 5,000 megawatts of solar—as much as one-quarter of all solar installed in the U.S. to date—on municipal property, with little to no upfront cash. It would allow cities to redirect millions in saved energy costs to other public purposes.
Download the full report
Read the Executive Summary
Read Part 1 of the report
Read Part 2 of the report
Read Part 3 of the report
Read Part 4 of the report
Read the full report in (poorly formatted) ePub or Kindle format
Podcast Conversations:
Lancaster, CA city manager Jason Caudle, listen to the podcast, read the interview summary.
Raleigh, NC renewable energy coordinator Robert Hinson, listen to the podcast, read the interview summary.
Kansas City project manager Charles Harris, listen to the podcast, read the interview summary.
Executive Summary
In 2012, ILSR published a pair of reports that projected, by 2021,10% of electricity in the U.S. could come from solar and at a lower price—without subsidies—than utility-provided electricity. In 2014 and 2015, Environment America’s Shining Cities reports examined how cities were catalysts for solar development.
However, there has been a missing piece in the examination of how cities can support solar energy: what city leaders have done and can do to use solar on their own buildings.
ILSR estimates that over 5,000 megawatts (MW) of solar could be inexpensively installed almost immediately on municipal property—more than a quarter of the nationwide total solar capacity through September 2014. This includes just the municipal buildings of the approximately 200 cities with 100,000 or greater population. But it requires city officials to overcome a few, surmountable barriers.
The Public Rooftop Solar Opportunity
The opportunity of municipal solar spans financial savings, pollution reductions, and job creation:
Energy Savings: New Bedford, MA, is saving $6 to $7 million per year on electricity through its 16 MW of solar installations on municipal properties, which is 2.5% of the entire city budget.
Greenhouse Gas Emissions Reductions: Maximizing New York City’s solar potential with 410 MW of solar would reduce emissions by 1.78 million metric tons, 3.7% of the city’s total emissions.
Significant Economic Impact: Maximizing Kansas City’s municipal solar potential of 70 MW could create 1400 jobs and add $175 million to the local economy.
Overcoming the Economic Barrier with 3rd Parties
The primary incentive for solar is the 30% federal tax credit, a deal that doesn’t apply to local governments. The federal government also provides accelerated depreciation for solar projects, resulting in a tax write-off worth nearly another 30% of a project’s value. The following charts illustrates how the limitations of federal incentives make the economics more challenging for municipally-owned solar.
Although cities face a number of challenges, economic and otherwise, to installing solar, the third party ownership option—if available—ought to trump most of them. For suitable sites that won’t need a near-term roof replacement, third party ownership removes virtually all of the financial barriers to solar, and covers maintenance and operations. While some barriers (like lack of aggregate or virtual net metering) remain, most cities have a substantial solar opportunity.
Barriers
While the most substantial barrier is cost, cities have named several other barriers to reaching their full solar potential:
Physical Limits: city structures may lack sunshine or suitable roof space, for example.
Historic / Aesthetic: some city buildings are historic and may have state or federal limitations on adding solar.
Expertise and Legal Issues: some cities are reluctant to negotiate solar contracts without greater in-house expertise.
Bureaucracy: cities may require multiple levels of approval for a single solar array.
Net Metering: aggregate net metering and virtual net metering substantially increase the maximum possible solar capacity for a city, but these policies apply to just 17 and 11 states, respectively.
However, Public Rooftop Revolution features stories from five cities that have overcome many of these barriers to solar on city property.
The Featured Five Solar Cities
ILSR’s featured five cities provide a fairly comprehensive look at how cities can overcome solar barriers, from cost to bureaucracy:
Lancaster, CA: leveraging an excellent solar resource, Lancaster city leadership has deployed several strategies to produce more solar energy on a daily basis than the entire city consumes.
New Bedford, MA: with favorable state policy, New Bedford is cutting city energy bills and deploying more solar per capita on city property than any other city.
Denver, CO: with plenty of open space at the city-owned airport and quality sunshine, Denver is using innovative financing techniques to ramp up city-owned solar.
Kansas City, MO: in the face of restrictive state policy and modest sunshine, this Midwest town still managed to put solar on 59 city buildings.
Raleigh, NC: even with cheap grid power and limited state policy support, this city has made significant strides in installing solar for municipal use with some innovative financing arrangements.
Spillover Effects of Municipal Solar
Municipal solar installations serve a purpose beyond city energy savings. Their presence on city buildings supports solar development in the private sector in several ways:
Inspiring private sector copycats to also install solar.
Giving valuable experience to local solar companies and driving down costs.
Helping city officials understand and simplify solar installations for residents and businesses.
Improving local policy, such as permitting, making solar simpler and less costly.
Sparking changes to state policy, as when the Dubuque, IA, attempt to install solar on a public works building resulted in a court case allowing third party ownership.
Cities have a unique opportunity to cut costs and emissions, boost the economy, and stimulate their solar market with investments in solar on municipal buildings. What are they waiting for?
Introduction
 A revolution is sweeping through the electricity system in the United States, and its name is solar. With costs falling precipitously, millions of electricity customers from Hawaii to Massachusetts are going solar, a dynamic that not only lowers costs and reduces pollution but is birthing a new, democratic energy system. Solar energy decentralizes power generation, but also breaks apart monopoly control to decentralize the economic benefits of the electricity system.
In 2012, ILSR published a pair of reports that projected, by 2021,10% of electricity in the U.S. could come from solar and at a lower price—without subsidies—than utility-provided electricity. Up to 100 million Americans could become electricity producers and, combined with solar arrays on commercial rooftops, U.S. rooftops could boast over 300 gigawatts of solar.

By focusing on major metropolitan areas, ILSR’s previous studies helped change the focus on solar energy, from utilities and states to cities. In 2013, we added to the solar analysis with City Power Play, a look at eight powerful policies for aligning a city’s interest in energy and the local economy. In 2014, Environment America published the first edition of Shining Cities, showing which cities were leading in solar development within their borders, and the policy and practical tools for accelerating solar in urban areas. Shining Cities is a terrific assessment of how some cities have already started to unlock their solar potential by removing barriers to deployment.
However, there has been a missing piece in the examination of how cities can support solar energy: what city leaders have done and can do to use solar on their own buildings.
Local governments own and operate hundreds of thousands of buildings. The advent of affordable solar energy provides cities a remarkable opportunity to reduce their operating costs, shrink their climate footprint, and boost the local economy.

For example, Kansas City, Missouri (pop. 467,000) has enough suitable rooftop space on municipal buildings to install nearly 70 megawatts (MW) of solar, producing enough energy each year to cut city electric bills by $8.7 million per year. Maximizing use of this rooftop space with solar would also create 1400 construction jobs and add over $170 million to the local economy.
 It’s also an environmental opportunity. Kansas City is among 1,000 cities that have signed onto the U.S. Mayor’s Climate Protection Agreement. But ILSR’s earlier research shows that few of these cities have been able to hold to their commitments. The 70 MW of solar possible on Kansas City municipal property could reduce the city’s greenhouse gas emissions by 15,300 metric tons per year. New Bedford, MA, already has more than 16 MW on public property, Lancaster, CA, has 9 MW.
Cities can also serve as a model for residents and businesses, leading by example and also by rule, using their authority over zoning, permitting, and taxing to make solar more economical. Kansas City has shortened permit waiting times to eight hours or less, provided online permitting, and lowered inspection times to eight hours or less. These efforts help the city rank 2nd in the Midwest in solar per capita, its 11 megawatts resulting in 25 Watts per person. Denver cut its solar permitting fee to just $50, helping to more than double citywide solar deployment from January 1 to December 31, 2014.
Despite the substantial benefits to the public (and private) sector of municipal solar development, few cities have done more than install a few solar panels when state or federal money is available. There are several barriers to municipal solar adoption, including ineligibility for federal tax incentives, competition for scarce operating and capital budgets, poor state policies, and others. ILSR’s research suggests these barriers can be overcome, and if cities took the lessons of New Bedford or Lancaster, they could generate an impressive amount of electricity from solar.
ILSR estimates that over 5,000 MW of solar––more than a quarter of the nationwide total capacity through September 2014––could be installed on the municipal buildings of more than 200 cities with 100,000 or greater population. These cities were selected for their size (and contain 20% of the U.S. population), but also because they inhabit states that allow them to contract with a third party owner to own and operate solar on their own property, and to receive the economic benefits of solar with zero money down. In other words, for suitable building sites in these cities, there are no meaningful barriers to maximizing municipal solar.
This report illustrates the broad municipal solar opportunity, tells the story of five solar cities, and identifies opportunities to overcome the barriers that have slowed solar’s adoption on public property.
The Public Rooftop Solar Opportunity
Solar on municipal buildings provides three direct impacts: energy savings, greenhouse gas emission reductions, and jobs. Unlike many other city expenditures, it also pays back on the city’s bottom line.
Many Megawatts and Energy Savings
Municipal buildings often have flat rooftops that are attractive sites for solar. For example, New York City could have over 400 megawatts (MW) on public buildings (four times more than Mayor de Blasio’s 10-year goal). San Francisco could generate 32 MW of power from school rooftops alone, nearly 10% of the city’s potential for all public and private buildings. Minneapolis, MN, could get 18 MW on public buildings.
 Several cities have already captured much of their potential. Lancaster, CA, generates enough solar energy, with 9 MW, to power over half its municipal operations and save approximately $450,000 per year. New Bedford, MA, is saving $6 to $7 million per year on electricity through its 16 MW of solar installations on municipal properties, which is 2.5% of the entire city budget.
Cities can save even more on solar with bulk purchasing. A joint procurement effort in the San Francisco area has 19 agencies issuing a joint request for proposals for 31 megawatts of solar to power 186 facilities. The total cost could be reduced by as much as 45%.
Greenhouse Gas Emissions Reductions
If rooftop solar for cities were just a matter of greenhouse gas reductions, then cities would be better off investing in energy efficiency.
Fortunately, energy savings, economic impact, and the many spillover effects into the private sector (discussed later) outweigh the relatively small reductions in greenhouse gas emissions. Additionally, many cities are able to install solar without any commitment of city dollars, achieving emissions reductions and energy savings simultaneously.
The following table illustrates the greenhouse gas emissions reductions potential of municipal solar for three cities. In Washington, DC, it’s based on a current proposal to install 10 MW of municipal solar; in San Francisco, it’s based on maximizing school rooftop potential (32 MW); in New York it’s based on maximizing public building rooftop potential (410 MW).

Washington, D.C. has 527,000 metric tons of emissions from government operations, 6% of the 8.9 million metric tons from all sources in the District. The city recently put out a request for proposal calling for 10 megawatts (MW) solar on municipal buildings. The 10 MW will produce 12.9 million kilowatt-hours (kWh) of electricity per year, displacing 12,300 metric tons of carbon dioxide (2% of the government’s emissions, 0.1% of total city emissions).
San Francisco has 5.3 million metric tons of carbon dioxide equivalent emissions per year (2010). Covering schools with 32 MW of solar would produce 49.7 million kWh of electricity per year, displacing 14,900 metric tons of carbon dioxide (0.28% of city emissions).
New York City has 48 million metric tons of carbon dioxide equivalent emissions per year (2013). In the next decade, the addition of another 100 MW of solar on municipal buildings would produce 132 million kWh of electricity and cut emissions by 433,000 metric tons (approximately 1% of the city’s total). Maximizing the city’s solar potential with 410 MW of solar would reduce emissions by 1.78 million metric tons, 3.7% of the city’s total emissions.
Significant Economic Impact
 More impressive is the fact that every megawatt of solar results in 20 local construction jobs and $2.5 million dollars added to the local economy. Solar also produces more jobs per megawatt of capacity than most other electricity sources.
Maximizing Kansas City’s municipal solar potential, for example, would create 1400 jobs and add $175 million to the local economy. For Minneapolis, it would create 360 jobs and add $45 million to the city economy.
Solar also reduces imports of fossil fuels for electricity generation. In Minnesota, for example, over $20 billion a year leaves the state for the import of fossil fuels for electricity, transportation, and building heating and cooling.
The Public Rooftop Solar Opportunity
Solar on municipal buildings provides three direct impacts: energy savings, greenhouse gas emission reductions, and jobs. Unlike many other city expenditures, it also pays back on the city’s bottom line.
Many Megawatts and Energy Savings
Municipal buildings often have flat rooftops that are attractive sites for solar. For example, New York City could have over 400 megawatts (MW) on public buildings (four times more than Mayor de Blasio’s 10-year goal). San Francisco could generate 32 MW of power from school rooftops alone, nearly 10% of the city’s potential for all public and private buildings. Minneapolis, MN, could get 18 MW on public buildings.
Several cities have already captured much of their potential. Lancaster, CA, generates enough solar energy, with 9 MW, to power over half its municipal operations and save approximately $450,000 per year. New Bedford, MA, is saving $6 to $7 million per year on electricity through its 16 MW of solar installations on municipal properties, which is 2.5% of the entire city budget.
Cities can save even more on solar with bulk purchasing. A joint procurement effort in the San Francisco area has 19 agencies issuing a joint request for proposals for 31 megawatts of solar to power 186 facilities. The total cost could be reduced by as much as 45%.
Greenhouse Gas Emissions Reductions
If rooftop solar for cities were just a matter of greenhouse gas reductions, then cities would be better off investing in energy efficiency.
Fortunately, energy savings, economic impact, and the many spillover effects into the private sector (discussed later) outweigh the relatively small reductions in greenhouse gas emissions. Additionally, many cities are able to install solar without any commitment of city dollars, achieving emissions reductions and energy savings simultaneously.
The following table illustrates the greenhouse gas emissions reductions potential of municipal solar for three cities. In Washington, DC, it’s based on a current proposal to install 10 MW of municipal solar; in San Francisco, it’s based on maximizing school rooftop potential (32 MW); in New York it’s based on maximizing public building rooftop potential (410 MW).
Washington, D.C. has 527,000 metric tons of emissions from government operations, 6% of the 8.9 million metric tons from all sources in the District. The city recently put out a request for proposal calling for 10 megawatts (MW) solar on municipal buildings. The 10 MW will produce 12.9 million kilowatt-hours (kWh) of electricity per year, displacing 12,300 metric tons of carbon dioxide (2% of the government’s emissions, 0.1% of total city emissions).
San Francisco has 5.3 million metric tons of carbon dioxide equivalent emissions per year (2010). Covering schools with 32 MW of solar would produce 49.7 million kWh of electricity per year, displacing 14,900 metric tons of carbon dioxide (0.28% of city emissions).
New York City has 48 million metric tons of carbon dioxide equivalent emissions per year (2013). In the next decade, the addition of another 100 MW of solar on municipal buildings would produce 132 million kWh of electricity and cut emissions by 433,000 metric tons (approximately 1% of the city’s total). Maximizing the city’s solar potential with 410 MW of solar would reduce emissions by 1.78 million metric tons, 3.7% of the city’s total emissions.
Significant Economic Impact
More impressive is the fact that every megawatt of solar results in 20 local construction jobs and $2.5 million dollars added to the local economy. Solar also produces more jobs per megawatt of capacity than most other electricity sources.
Maximizing Kansas City’s municipal solar potential, for example, would create 1400 jobs and add $175 million to the local economy. For Minneapolis, it would create 360 jobs and add $45 million to the city economy.
Solar also reduces imports of fossil fuels for electricity generation. In Minnesota, for example, over $20 billion a year leaves the state for the import of fossil fuels for electricity, transportation, and building heating and cooling.
Public Solar Economics
Although the cost of installing solar has been falling rapidly (by nearly 75% over the past 5 years), cities have a substantial disadvantage to private property owners when installing solar. The primary incentive for solar is the 30% federal tax credit, a deal that doesn’t apply to local governments. The federal government also provides accelerated depreciation for solar projects, resulting in a tax write-off worth nearly another 30% of a project’s value.
To access incentives and avoid upfront costs, cities have sought legal arrangements to lease or purchase solar energy via third parties. After all, even half an incentive (typically what’s left for the city after one of these arrangements) is better than no discount, and many cities are reluctant to use their borrowing power for solar in competition with other potential capital expenses.
The chart below from ILSR illustrates the challenges for tax-exempt entities like cities in financing solar. A city’s best option is to purchase electricity from a third party (a power purchase agreement, or PPA), but that’s only legal in about half of U.S. states. A lease is second best, but usually allows only capture of the tax credit or depreciation. Direct purchase by the city means no federal incentives can be used. thus more costly energy. Private entities that can use federal tax incentives get the lowest solar prices of all. Using cash grants instead of tax credits—as was done during the aftermath of the financial crisis—would put cities on par with private entities in access to incentives.

The following chart illustrates the lifetime benefit (also known as net present value) for three primary ways a city can finance a solar array: municipal bonds, a power purchase agreement (with a fixed rate), or a lease. We use the same cost assumptions for all three scenarios, although they differ most in that a city-financed solar array gets no incentives, a leased project (in our example) can use the federal tax credit but not depreciation benefits, and a power purchase can use both tax credits and depreciation. The selected cities are highlighted later in our Featured Five section.

Third party ownership fares better than direct city investment in every case, largely because the solar developer can use and pass through one or both federal tax benefits. The relative benefit of third party options is substantial, especially for cities with low electricity prices and relatively weak sunshine, like Raleigh. In cities with high electricity prices, like New Bedford, or abundant sunshine, like Lancaster, direct city ownership is economically viable, if less attractive.
The following table shows the information presented in the above chart.

To understand a bit more about how third party ownership can help cities save money immediately, the following table shows how a power purchase contract or a solar lease would impact a city’s budget on day one, if a city were able to sign this kind of third party agreement.

It should be noted that Raleigh’s case is hypothetical because the power purchase contract is not legal in North Carolina (hence the strikethrough), but it’s also instructive. Despite having a higher price than the current cost of power from the electric company, the power purchase agreement or the lease is worthwhile in the long run. This is because the city can buy the system at a fraction of its upfront cost when the agreement expires, and continue to get electricity with no additional payments
In reality, Raleigh may have already discovered a better option. Instead of leasing the panels of the solar project, the city is leasing land to solar producers, with an option to purchase the solar array after 7 years (when the initial owner has cashed in the federal tax incentives).
The above comparisons are meant to be illustrative, since many cities—like Raleigh—don’t have recourse to power purchase arrangements. As of April 2015, in fact, laws governing this form of third party ownership were either unclear (making projects risky) or clearly disallow it in 26 states.

The Policy Difference
Third party ownership laws are a state fix for a federal incentive problem (although it can simplify solar for public or private building owners). If the 30% discount were available to local governments without complicated legal arrangements, then solar barriers would drop substantially. For example, if New Bedford could use the 30% federal tax credit, city ownership would stack up very favorably to third party ownership, especially given the city’s edge in obtaining low-cost financing.

Sensitivity
While our assumptions about power purchase and lease terms offer a particular picture, they are just assumptions. What if electricity prices stop increasing or rises faster? What if a city signs a power purchase or lease contract that escalates in price each year?
The following table illustrates how changes in our assumptions changes the lifetime value of solar to a particular city: New Bedford, MA. Figures in bold are values that change based on our sensitivity assumptions.

There are a few lessons in this analysis:
Since electricity prices are expected to rise, a fixed power purchase contract can have a significantly higher price (A) than a city’s current electricity price and still be a good deal in the long run.
With a lease contract (or PPA), if the annual cost inflates too much (B), the value of third party ownership compared to city ownership largely disappears.
Assumptions about electricity cost inflation matter a great deal. If we assume prices rise by only 1% per year instead of 2.5% (C), it sharply reduces the value of solar, although it’s still greater than zero. Much higher annual increases in grid electricity prices (D) makes all ownership options very attractive.
Even with fairly conservative assumptions about electricity prices and potential contracts, third party ownership makes sense and saves cities money on solar energy.Barriers
Many cities have identified barriers to expanding municipal solar installations, and sometimes ways to overcome them.
Physical Limits
An initial screen of solar suitability focuses on building rooftops, and many public buildings may lack structural strength to host solar, have obstructions on the roof (e.g. from heating or cooling equipment), or have significant shading. Generic studies of rooftop potential show that as much as 40% of commercial building roof area is unsuitable for solar because of shading or structural inadequacy. Cities may also be reluctant to install solar if the building roof is old, since roof replacement requires moving and reinstalling the solar PV system.
Charles Harris, Project Manager for Kansas City, says that over 90% of city properties are unsuitable for solar and cited insufficient structural integrity and unsuitable surroundings as two primary reasons.
Even accounting for these barriers, however, few cities have built anywhere near to their maximum solar potential. In other words, there are additional barriers.
Historic / Aesthetic
In some cities, municipal buildings may have historic significance, and installing solar may be prohibited or restricted by state and federal law. In other cases, solar will––in the mind of local officials and/or residents––detract from the building’s appearance.
There have been several prominent news stories about solar on historic (though not municipal) buildings. Several neighborhoods in New Orleans have historic designation, limiting what homeowners can install and blocking at least one residential project. Historic preservation guidelines in Washington, DC, suggest that panels should not be visible from the street, causing a home rooftop project to be halted. In Texas, some residents who oppose solar installations in their neighborhood because of aesthetic reasons or a fear that a neighbor’s solar system will reduce their property value, are using their homeowner association covenants to try to stall or stop solar installations.
State and national guidelines tend to strike a balance. The state of Massachusetts recommends against cities adopting restrictions on solar related to aesthetics, as it can “create roadblocks to actual installations.” The National Trust for Historic Preservation highlights a number of successful state and local policies for accommodating solar installations on historically designated properties.
Even with historic buildings, national solar installers—Tony Clifford, CEO of Rockford, MD-based Standard Solar and C. Tucker Crawford, CEO and co-founder of New Orleans-based South Coast Solar LLC—feel solar and historic properties can co-exist:
Crawford and Clifford do not believe that solar guidelines for historic districts are too onerous for installers. A typical New Orleans house, for example, has a required setback distance of about 10 feet from the front of the home’s wall line to where a panel can be installed.
Once again, this barrier likely applies to a minimum of municipal buildings in most cities.
Cost
Money is a frequently mentioned barrier for solar. With a high initial cost, a cash purchase of solar competes against other city general fund priorities. Even if the city borrows the entire cost of solar, its capital budget may be restricted by the city’s existing debt load (and finance payments), state limitations on city borrowing, or by competition from other capital investments (e.g. roads, buildings, etc.).
Cities are also ineligible for the 30% federal tax credit and accelerated depreciation, and alternative incentives (such as clean renewable energy bonds) may require staff time for applications and/or funding approvals from Congress.
Third party ownership––power purchase agreements and leasing––allow cities to skirt both upfront and borrowing costs, and to access financial incentives for solar. But as mentioned previously, cities in 26 states could be prevented from using these ownership structures.
Raleigh, NC, has perhaps the most creative workaround on upfront costs and legal limitations. Their solar installations provide the city revenue simply from leasing the land or rooftop on which the solar installation is located. In time, the city may be able to buy out the developer and directly own the solar array (and use the energy), at a fraction of the initial cost. This may be a strategy that more cities can employ, but likely requires a utility to purchase the electricity.
Expertise and Legal Issues
Some cities have been hesitant to more aggressively pursue solar, even with cost-effective third party opportunities, due to worries about getting a good deal from solar providers. These cities may have minimal experience with negotiating energy purchase, lack legal expertise or have other perceived barriers. Some cities, such as Kansas City, specifically mentioned lack of sufficient dedicated staff time as a barrier or that negotiation process was a hassle.
Other cities, like Lancaster, have responded that the risks of signing solar contracts is little different from other procurement, and just requires due diligence in contract writing. Denver found the negotiations simple enough that it shifted away from direct ownership to power purchase contracts.
Bureaucracy
Although opinions differ between the solar installers we spoke with, some consider working with municipalities to be fairly onerous. One solar developer in the Southeast was particularly grim—”We don’t have the time or money for bureaucratic government.” In particular, he noted the “large transactional cost” but also that tax equity investors (required to absorb the tax incentives that cities can’t use) prefer larger projects to the relatively small scale of work in cities.
A solar developer from Borrego Solar also noted the complexity of municipal decision making in an interview for Solar Industry magazine:
Borrego Solar’s [Joe] Harrison says he encountered many of the unique aspects of dealing with municipalities as customers in developing a 2.7 MW project for the City of Beverly, Mass. The array is on a private site, but the city is purchasing the net metering credits. Harrison says the approval process involved five city council meetings, three subcommittees and two public meetings.
“We had sort of thought we would receive approval at the first meeting,” he says.
But in the same article, Harrison also said that municipal contracts have their upside:
“There are pros and cons to working with municipal customers,” says Joe Harrison, senior project developer in the Boston office of San Diego-based Borrego Solar Systems. “The private sector is able to move quicker when they make a decision. On the other hand, the private sector is not obligated to follow through. You are always one phone call away from having the customer go with someone else.”
[Municipal customers] are big users motivated to do the right thing for the community,” he says.”
The good news is that cities have choices among contractors. Tom Tuffey, vice president of Community Energy Solar LLC in Pennsylvania said that “in some cases, we have had municipals with up to 40 solar developers that have approached them.”
Net Metering
Although it’s a crucial policy enabling solar installations, net metering—allowing electric customers to reduce their energy bill by netting their solar energy production against their energy consumption (on a monthly or annual basis)—can also be a barrier. To use net metering, the solar installation must typically be on the property and connected to the same meter where electricity is being consumed. States may have size limits on net metered solar installations, e.g. 50 kilowatts. In this case, a building that uses more energy will not be able to offset all its consumption, even if it had sufficient sunny roof space.
Certain net metering rules can lift these limits. Some states have no hard size cap at all, but simply restrict project size and output relative to onsite electricity use. Other states have “aggregate net metering,” allowing electric customers to offset energy use at multiple meters/buildings with a single solar array connected to one of them. “Virtual net metering” goes a step further, allowing the solar to be installed offsite.

The Third Party Trump Card
Although cities face a number of challenges, economic and otherwise, to installing solar, the third party ownership option—if available—ought to trump most of them. For suitable sites that won’t need a near-term roof replacement, third party ownership removes virtually all of the financial barriers to solar, and covers maintenance and operations. While some barriers (like lack of aggregate or virtual net metering) remain, most cities have a substantial solar opportunity.
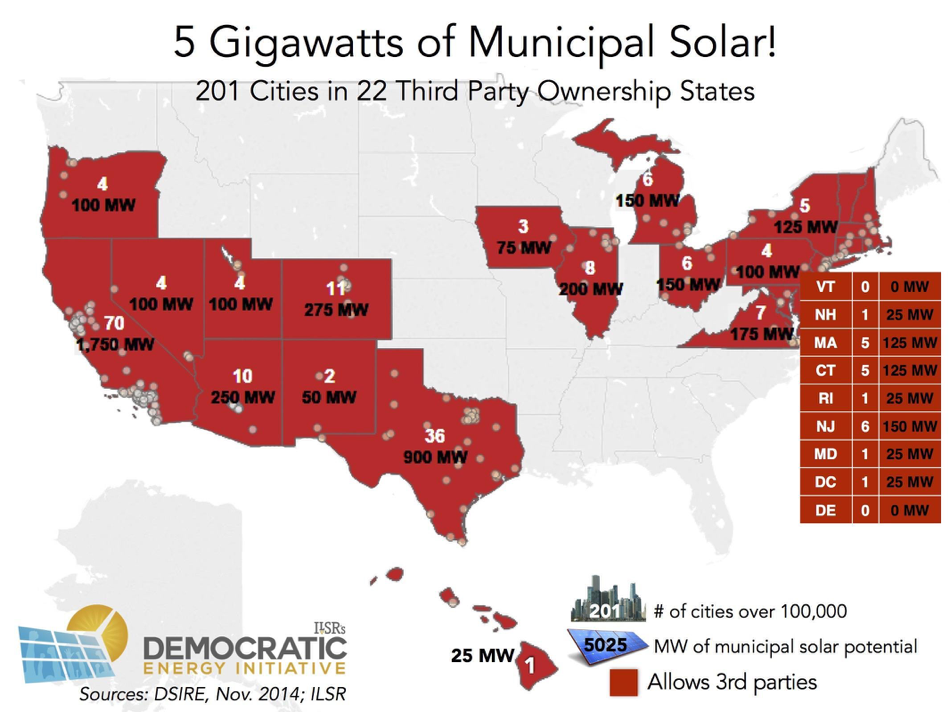
ILSR estimates that over 5,000 MW of solar could be inexpensively installed almost immediately on municipal property in states with laws allowing third party ownership. This amount is more than a quarter of the nationwide total solar capacity through September 2014, and it only includes the municipal buildings of the approximately 200 cities with 100,000 or greater population.
We arrive at this number by estimating the solar potential for cities in states where third party ownership is allowed, based on the following four estimates of rooftop solar potential ILSR obtained. The estimates are shown in the table below.

Although there’s an impressive range of potential from this small sample, ILSR estimates that each city can, on average, install 25 MW of municipal solar. For comparison, the city with the most municipal solar Watts per capita, New Bedford, MA, has 16 MW, but is also smaller than 100,000.
The result is an impressive array of municipal solar potential in 23 states (plus DC) with third party ownership and 201 cities larger than 100,000. Cumulatively, these cities could have third parties install over 5,000 MW of solar on municipal buildings, as shown in the map below. Note that two states allowing third party ownership have no cities larger than 100,000 population, Vermont and Delaware.
Though the map says it powerfully, it’s worth repeating that there’s an enormous solar opportunity waiting for cities to seize it.
As a word of warning, this estimate may not account for the wide variation in solar net metering laws. While solar-leader New Bedford can obtain over a third of its solar for municipal use off-site (using virtual net metering) and apply solar production on any city property to any of its utility bills (aggregate net metering), cities in other states will find net metering policies less favorable. They may be constrained to using just what space is available and suitable on their own property, and perhaps not even be able to aggregate their energy use across properties to find the must suitable solar site for serving municipal-wide needs.
The Featured Five Solar Cities
The following five cities were selected to provide a diverse view of municipal solar leaders. Some, like California’s Lancaster, have a particularly good solar resource and high electricity prices that have enabled them to quickly maximize solar installations. New Bedford has benefited from high electricity prices and terrific state policy. Kansas City and Raleigh illustrate how cities can succeed even against challenging odds. Denver has used substantial open land at its distant airport to significantly expand its solar capacity.
These solar leaders don’t always have the most solar per capita, but their story can help other municipalities navigate how to add more solar on public buildings.
The following table features the installed solar capacity on municipal property for cities for which ILSR was able to obtain data. There are likely some cities that have more Watts per person on municipal property that we could not identify prior to publication.

Bold denotes featured in this report
In the introduction to each city, we share some basic comparable statistics. Of particular interest is the cost of (unsubsidized) solar. In two cities of our Featured Five, Lancaster and New Bedford, solar is cheaper than grid electricity, helping drive substantial development.
Lancaster, CA
 Located just north of Los Angeles in the arid Antelope Valley, the city of Lancaster is quickly becoming the solar capital of the United States. Led by a visionary mayor, the city is aiming for net zero carbon emissions from electricity consumption. The goal is to produce more electricity from solar “on a daily basis” than the entire city consumes (requiring 530 MW of solar capacity installed). The bold goal has led to significant solar installations on public and private property.
The city has contracted substantial solar capacity for its own use—9 MW—sufficient to produce all of the electricity consumed by schools and 90 percent of the usage of five municipal buildings, at an annual average price––13 cents per kilowatt-hour––lower than that offered by the incumbent electric utility. The savings to the city are approximately $450,000 per year.
 The effort to install municipal solar has also helped the city near its Phase 1 benchmark toward net zero. With 118 MW installed by May 2015 (9 MW on public property), the city is over halfway to producing enough energy with solar to meet the city’s peak energy demand of 215 MW. With projects in the pipeline, the city expects to reach this goal by the end of 2015.
The solar push began in 2010 with power purchase agreements for solar installations on city hall, a performing arts center, and the municipal stadium (host of the JetHawks minor league baseball team). Together, with two other cities properties, the five sites generate 1.5 MW from solar and save the city $50,000 per year in electricity costs. The power purchase arrangement means that SolarCity owns the solar arrays on the public facilities, but it sells the electricity to the city at a discount to grid electricity prices. This allows SolarCity to capture federal tax incentives for building solar arrays and the city to benefit as well.

It was the next phase of Lancaster’s solar expansion highlighted the city’s willingness to innovate. The city rejected a power purchase agreement offered by SolarCity for city schools, saying it was “unaffordable.” Instead, the city formed a public power agency to purchase the panels outright and sell the power to the city’s schools.
[Financed by low-cost municipal bonds], it bought 32,094 panels, had them installed on 25 schools, generated 7.5 megawatts of power and sold the enterprise to the school district for 35 percent less than it was paying for electricity at the time.
The school investment model is one that the city hopes other cities can emulate, in part because the arrangement still allows for capture of the federal tax incentives. The power agency bought the solar arrays from SolarCity, but the contract leaves the company responsible for maintenance and a guaranteed minimum level of electricity output. The agency, dubbed the California Clean Energy Authority, sells the power to the school district on a long-term contract. In addition to selling power to the schools, the Energy Authority also earns revenue from leasing land under its control to third party solar developers, similar to what Raleigh, NC, is doing.
 Though it has yet to be tapped, Lancaster’s Clean Energy Authority offers the same opportunity to any California municipality interested in leveraging its low cost of capital without becoming a municipal electric company. The city doesn’t have to own poles or wires, or operate the electric grid, but it can finance solar panels and other renewable energy equipment at very low cost.
Lancaster’s solar success results from its ingenuity and a number of other key factors. The mayor, city council, and city manager have all been big advocates of the solar efforts. Lancaster’s solar resource is about 30% better than the U.S. average, meaning it gets 30% more electricity than an identical solar array installed in, for example, Missouri. State policies have also been very helpful:
- California does not require the city to competitively bid the solar power purchase contracts.
 The California Solar Initiative has provided performance-based incentives for solar electricity production for several years, though they have now expired.
- State policies have dramatically simplified interconnection of solar and allow third party solar purchasing arrangements.

Beyond Municipal
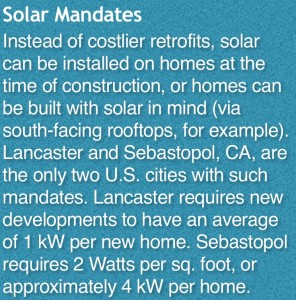
Lancaster’s net zero goal means the city is pushing for local clean energy beyond municipal operations. In 2010, the city co-marketed a “Solar Lancaster” partnership with SolarCity—with financing and discount purchasing program—to get solar installed on 130 homes. At the same time, the city streamlined rules for solar on private property, earning a “Good” score on its permitting practices from Vote Solar. It has also partnered with home developer KB Homes to construct net-zero energy homes in Lancaster, dramatically lowering both electricity and water consumption.
 In 2013, the city adopted a solar mandate, requiring all new housing developments to have an average of 1 kilowatt of solar per home.
In 2015, Lancaster is launching a community choice aggregation program. The aggregation program gives the city the power to choose the energy supply on behalf of its residents and small businesses. The implementation plan calls for 185 MW of local utility-scale renewable resources and 33 MW of distributed solar within city boundaries and additional resources from the larger grid. Any potential supply could include contracting with large-scale wind or solar producers, or standard contracts to buy solar power from Lancaster residents and businesses.
All told, Lancaster is a model for both public and private sector solar installations. Its municipal solar capacity puts it among the top cities in the country in public solar per capita. The push beyond municipal solar has also been successful. The city has enough solar in the pipeline to match the city’s peak daily energy demand of 215 MW by the end of 2015. With its local aggregation able to make decisions about the energy supply, the city is well on its way to its net zero goal of 530 MW of solar.
New Bedford, MA
Wha le oil made New Bedford an energy capital of America in the 19th century. Today this coastal Massachusetts town continues to lead with solar energy for municipal use, not because of abundant sun or wealth—New Bedford family median income is nearly one-third lower than for the U.S. as a whole— but due to good policy.
The city jumped into solar on the heels of the 2008 Massachusetts Green Communities Act, which was designed to accelerate the development of energy efficiency and solar energy. This Act provided several key tools:
 Boosted the maximum size of net metered projects, improved compensation for excess generation, and allowed more net metered solar to be installed; also, set a statewide 250 MW solar target, since surpassed.
Provided technical assistance for procuring renewable energy for towns that adopt specific energy conservation measures, tougher building energy codes, and policies encouraging private sector development of renewable energy.
Created a market for solar renewable energy credits (SRECs) that accrue to all grid-connected solar projects for every megawatt-hour of energy produced. High prices for these credits—50-57¢ per kilowatt-hour in early years, and averaging 25-27¢ per kWh since 2012—help speed payback of solar investments.
New Bedford’s energy office opened in 2010, with the goal of having 10 MW of solar installed by 2015, to meet 25% of municipal energy needs. By late 2014, the city had far surpassed its goal, with 16.25 MW of installed solar capacity, sufficient to meet 52% of the city’s municipal electricity needs.
 If, for example, a city has three buildings with separate meters, it would have to install solar on each site to offset that site’s energy use. Aggregate net metering lets the customer combine their meters and offset their entire electric bill with a solar array located at just one site.All of the city’s solar capacity is financed via two power purchase agreements with SunEdison and Con Edison Solutions. With its tax equity investors capturing federal and state tax incentives, SunEdison sells the solar electricity to the city for 12 to 16 cents per kilowatt-hour—far below market rates. The city gets just under half the solar energy from installations on eight city properties, and the remaining half from two off-site, though nearby, solar arrays. The savings on the city’s $6 to $7 million electric bill amounts to 2.5% of its entire budget!
Scott Durkee, director of the city’s Energy Office, cites several innovative policies for the city’s success with solar. The state’s 2008 Green Communities Act was key, offering technical and especially financial assistance to communities that made a number of commitments to facilitate conservation, efficiency, and clean energy. Multiple incentives pushed costs down, including the 30% federal tax credit (taken by SunEdison), the double depreciation allowed through the federal stimulus law in 2009, and the SRECs that have been sold to other utilities.
Three other policies played a key role:
The availability of the power purchase option for the city to buy power from a non-utility supplier (legal in 24 states);
Aggregate net metering (legal in 17 states), which allows the city to apply power production at one municipal site, e.g. the water treatment plant, against all the city’s meters;
Virtual net metering (legal in 11 states), which allows solar energy produced anywhere in the utility’s service territory to be applied against the utility bill of the city. Half the city’s solar electricity comes via this kind of off-site installation.
The city has nearly reached its limit on solar potential. State net metering limits cap additional production from the already selected sites, and structural and shading issues prevent the use of additional buildings.
Solar is the start, but it is a spark toward greener and more efficient energy use for the city.
The mayor sees the solar panels as the first step in a broader plan. His goal is to eventually obtain all of the city’s electricity from renewable sources. He would also like to replace New Bedford’s municipal lighting with more-efficient LED bulbs, convert oil-fired boilers to run on natural gas, and refit city buildings with insulation and new windows.
Street lighting, greener fueling, and energy efficiency management tools are already projected to reduce the city’s electric use by 20%. The cost of financing the street lighting project (completed in 2014), is more than offset by the $550,000 in annual savings in electricity and maintenance costs.
Like Lancaster, the city is also trying to extend energy savings and solar to its residents and small businesses. The Energy NOW program, launched in 2012, combines energy efficiency, solar, and a conservation challenge. It offers a no-cost energy assessment, financing, and promises to use local labor for weatherization or solar installations. The city also has discounted pricing on solar panels purchased through the program.
New Bedford’s Energy Office director has this advice for other cities:
Don’t be too conservative. Go big, and perhaps go solar. “It is critical that you understand your capacity,” he says, “and that capacity will then drive how aggressively” you plan your energy-buying strategy, aiming to reap economies of scale. New Bedford discovered it has a “wonderful capacity” for solar. Other cities may not have it, or may elect to rig just a few buildings, “but anything they do is better than standing with the status quo.”
Denver, CO
 The mile-high city of Denver is just a bit closer to the sun than most American cities and it has accordingly taken action. The city has nearly 14 MW of solar installed on public buildings, including 10 MW at its international airport. The municipal solar represents a quarter of all solar installed in the city, a total capacity that puts Denver among the top 15 of U.S cities.
When the city first installed solar on its buildings, it purchased the panels outright to maximize its return on investment. Over time, though, the city shifted to using power purchase agreements to reduce its upfront and maintenance costs. These agreements are now the dominant financial structure for municipal solar in Denver.
Denver is known as much for employing innovative strategies to fund its solar installations as it is for its substantial solar capacity. For example, while the four-part airport solar project got its start in 2008 with generous utility and federal tax incentives, the final segment employed a unique twist on the power purchase contract.
 All four segments are owned by third parties, with the city purchasing the electricity on long-term contracts at a savings over grid electricity. But in the final phase, the solar company building the solar array borrowed $4 million of the $7 million project cost from the airport itself, with the loan secured by the panels and the project’s renewable energy credits. Since the federal tax credit and accelerated depreciation returns nearly 50% of the project’s cost to the developer within the first 5 years, the default risk is minimal.
Another of Denver’s touted solar projects is a partnership between the city and the county Housing Authority. A power purchase agreement with Enfinity America Corporation allowed the installation of 2.5 MW of solar on more than 350 Authority affordable housing properties, averaging 6.5 kilowatts (kW) per property. The agreement was essential, because the Authority lacked the capital to install the solar outright and allowed the government program to take advantage of the federal New Markets Tax Credit, which provides a discount of 39% on “investments into operating businesses and real estate projects located in low-income communities” over seven years.
The Housing Authority benefits from the solar installations in two ways: It pays less for electricity as a result of the agreement, and it receives revenue from leasing the roofs to the solar company. Altogether, the project generates “3.4 million kilowatt-hours of electricity per year, which is an annual reduction of around 3,400 tons of carbon dioxide”
Denver has largely stopped expanding its solar investments for two reasons. First, many of the publicly-held properties have neither sufficient roof strength to hold the additional weight of solar panels nor a south-facing, sunny rooftop. Second, the city is interested in waiting to see whether predicted price reductions and technology improvements will make future solar investments even more cost-effective.
Despite slowing its own solar investment, the city has taken steps to make solar on private property more affordable. Supplementing strong state policies on net metering and low-cost grid connections, the city has reduced solar permitting fees to a flat $50 and introduced same-day permit review. Solar projects are also getting priority scheduling for city review.
Denver has become a municipal solar leader in part because the airport’s energy use and open land enable simple and substantial solar installations without having to use virtual net metering. For now, that may be the limit to Denver’s municipal solar installations.
Kansas City, MO
 Kansas City, MO, has neither the abundant sunshine nor high cost of electricity that have driven solar installations in other cities. Despite this, the city has close to 1.5 MW of solar in 59 separate installations on municipal properties. Due to utility rebates, two department leaders, and a unique opportunity that allowed it to access the 30% federal tax credit, the city was able to make solar work in an otherwise challenging climate of modest sun and low electricity prices.
Like many other cities, Kansas City was able to lease its solar arrays in order to avoid the upfront costs of installation and to allow access, via a third party, to the 30% federal tax credit. In an interesting twist, the city leases from two entities: Brightergy, a solar developer, and Kansas City Power and Light, the incumbent investor-owned utility. This leasing option was available for projects through 2011, when solar installers could take a cash grant on behalf of tax-exempt customers in lieu of the federal income tax credit. According to some IRS provisions, some projects installed after 2011 could still use this structure (the lion’s share of Kansas City’s solar installations were put up in 2013).
In the end, the effort was worthwhile. The 1.5 megawatts of solar has reduced the city’s $21 million electric bill by $166,000 per year, or about three-quarters of a percent. The net effect is much smaller, about $15,000 per year, after factoring in the lease payments.
 Kansas City is unique in installing all its solar energy at the same time, in one project deal. City staff have noted that the city faced a number of challenges in executing the project that may have hampered repeat efforts.
Aside from the common financial challenges of adding solar to public buildings, the city also faced resistance from city departments to installing solar. In some cases, buildings were scheduled for near-term roof replacement or the occupants felt solar would detract from the buildings’ appearance. Other buildings were not suitable for solar because of shading, structural limitations, or having too little load to offset (Missouri is not one of the 11 states that allow cities to use virtual net metering, or one of the 17 states to allow aggregating buildings to use solar energy produced at one site to offset another site’s electricity use). Although the mayor and city council have expressed interest in getting solar on city property, it was the General Services department and Office of Environmental Quality that led project work.
 One uncommon twist on Kansas City’s solar efforts was the structure of the rebate program offered by Kansas City Power and Light. The rebates (up to $2.00 per Watt initially) were only available for solar projects 25 kilowatts or smaller, so systems were sized to that limitation whether or not the municipal site could effectively use more on-site electricity.
The city also had issues with meeting its goals for using minority- and women-owned businesses to do the solar installations, since so few had the necessary experience with it.
A final challenge was the power purchase negotiations, which took “an extended amount of time and effort.” The project manager, Charles Harris, explains:
“It was a bit of a new concept for us. The City has many requirements even in such a hybrid type arrangement and we had to make sure that the minority participation component was met. Also, when attorneys are involved, making sure the interests of both sides get satisfied tends to slow the process.”
Kansas City continues to explore opportunities for adding more solar. The initial surge was driven by two department directors, while other department heads were more reluctant. A new ordinance requiring LEED building certification will likely increase interest in solar for new or renovated municipal buildings. Cost-effectiveness could hinge on availability of solar rebate programs that have periodically been exhausted. Harris suggested that, despite solar installations that typically cost $3/Watt or less, both utility and lease provider would still require a $2/Watt rebate to extend the lease program to new installations.
The city and regional government have also used their solar experience to streamline solar installation for the private sector. In the past few years, Kansas City shortened permit waiting times to 8 hours or less, provided online permitting, and lowered inspection times to eight hours or less. These efforts help the city rank 2nd in the Midwest in solar per capita, its 11 megawatts resulting in 25 Watts per person.
Kansas City’s experience with solar included a single, substantial program across numerous government buildings, as well as a few smaller projects. It’s unclear whether the city has much opportunity to expand its solar investment, particularly given the constraints of the state’s net metering policy and lease providers with apparently very high financial requirements.
Raleigh, NC
 There aren’t many solar success stories from the Southeast, making Raleigh stand out in a region with low-cost electricity and modest sunshine. With just over 2 MW of solar on public property–– providing close to 7% of municipal building peak demand––Raleigh’s solar success comes despite state rules preventing the use of non-utility power purchase agreements.
Instead, the city leases land to third parties to install and own solar arrays, with options for the city to buy the arrays (at “fair market value”) after seven years have elapsed and the federal tax incentives have been digested by the developer.
 For example, a 250-kW array at the EM Johnson Water Treatment Plant was completed in 2010, and the project owner, Carolina Solar Energy, sells the solar energy to the incumbent utility, Duke Energy. The City of Raleigh earns $1,800 annually from leasing the project land. A 1.5 MW array at the Neuse River Wastewater Treatment Plant has a similar arrangement. The lease calls for annual payments to the city of about $16,000, rising by 3% per year. In both cases, the city has the option to purchase the solar array after seven years once the federal tax incentives have been fully utilized.
Along with smaller, city-owned solar arrays, the city is saving the city between $35,000 and $45,000 per year in combined lease rental payments and reduced electricity bills.
 The projects were made possible because of state solar tax credits (35% off) and a premium-price contract from the former utility, Progress Energy, which has since become a subsidiary of Duke Energy.
Unfortunately, as state and utility incentives have shrunk, so has the city’s solar expansion. The city offers several reasons for its retrenchment:
- Operational staff is wary about dealing with third parties, and they fear attorney and staff time expenses.
- Duke Energy is slower in closing power purchase agreements than the former utility, Progress Energy, and its policies have been less favorable toward solar development.
- City-owned solar cannot compete favorably against 9¢ per kWh utility electricity without use of the federal 30% tax credit, and investors are no longer showing as much interest in the city as in the early days of North Carolina’s solar boom.
The situation may change in Raleigh’s favor, as the legislature considers a bill to legalize third party ownership of solar panels in the 2015 session. This would allow the city to mimic Lancaster and New Bedford in buying electricity directly from non-utility developers. However, it’s unclear if these developers could profitably beat the price of electricity from Duke Energy without time-of-use pricing or identify another strategy to increase solar revenue.
Raleigh is like many U.S. cities that face substantial policy barriers to solar at the state level, but have found innovative local solutions to overcome them. However, it may have reached the limit of its opportunity without lifting some of those barriers.
Spillover Effects of Municipal Solar
Municipal solar installations serve a purpose beyond city energy savings. Their presence on city buildings supports solar development in the private sector in several ways:
- Copycat: The visibility of solar on public buildings can inspire individual residents or businesses to invest in solar.
- Market experience: Public building installations also provide valuable installation experience to local solar companies, driving down costs.
- Internal experience: The installation of solar arrays on public buildings provides valuable experience to affected city staff such as building, electrical, and fire code officials who regulate the private solar market.
- Local policy: The city’s interest in solar can lead to more favorable rules and regulations for private solar installations, reducing permitting and licensing requirements. Denver, CO, is given a “Best” score by Vote Solar, and has among the easiest and lowest cost permitting rules in Colorado. Lancaster, CA, is given a “Good” score from Vote Solar, with many streamlined processes. New Bedford, MA, has below average permitting fees compared to other Massachusetts municipalities. Kansas City shortened permit waiting times to 8 hours or less, provided online permitting, and lowered inspection times to eight hours or less.
- State policy: A municipal solar project may also help change state policy. In Dubuque, IA, a proposed solar installation using a power purchase agreement sparked a legal battle when the utility objected. The Iowa Supreme Court ultimately determined that power purchase agreements were legal, and the ruling has generated substantially more interest in public sector solar installations.
Solar on public buildings can also serve as a starting point for municipal interest in deeper clean energy opportunities, beyond solar. Municipal electric vehicles could charge from municipal solar arrays, for example, as they do in Lansing, MI. City buildings with solar could also incorporate storage, making them safe severe weather shelters. Florida’s SunSmart Schools and Emergency Shelters Program has installed 115 10-kW PV systems with electricity storage at Florida’s schools to create emergency shelters. Rutland, VT, is building a microgrid with solar plus battery storage to power the public shelter during severe weather emergencies. New York City is interested in installing 800 megawatts of distributed generation, and the city’s not-for-profit economic development corporation is planning a large battery storage system at the Brooklyn Army Terminal.
Solar on city buildings has many benefits, from energy savings to jobs to greenhouse gas emissions reductions. But it also builds city experience in managing its own energy consumption and in driving a cleaner and more efficient local energy economy.
Summary
Only a few cities have realized the advantages of siting solar energy generation on their buildings. The most likely reason is the only-recent affordability of solar, but also that solar is a new entrant in the competition for a city’s capital and/or operating budget.
For many cities, these barriers are easily overcome. Third party ownership allows them to have solar installed on public property at zero upfront cost and often with immediate savings to the city’s energy budget. Savings can be large enough, especially over time, to free up additional operating or debt service funds. It’s a gift that keeps giving, since many third party arrangements allow the city to assume ownership of the solar arrays at minimal cost after 15-20 years, allowing for many more years of energy savings.
Cities with this simple solar option and that have commitments to reduce greenhouse gas emissions should be especially eager to maximize their solar potential, since the savings are to the “triple bottom line”––financial, environmental, and social.
Not only can city-installed solar reduce environmental and financial impacts on the city, but it creates local jobs and generates experience for solar installers, and can serve as an example for private market solar development. There are several examples of cities with substantial municipal solar installations providing much easier permitting and inspection requirements for solar development.
Barriers remain to city-installed solar. Cities in half of U.S. states still lack access to the power purchase arrangement that minimizes their financial risk. Net metering rules in most states require cities to match their solar installations with on-site building load, limiting the utility of their many rooftops to those that are suitable, sunny, and serve significant on-site energy use. Many cities lack the internal expertise to pursue solar.
Our Featured Five cities show how these barriers are surmountable. Even in states with the least favorable policy, cities like Kansas City and Raleigh are making solar work. And these cities can be models and teachers for the cities that have yet to take up the solar charge.
Cities have a unique opportunity to cut costs and emissions, boost the economy, and stimulate their solar market with investments in solar on municipal buildings. What are they waiting for?
Appendix
Actual solar PPA terms used to inform this analysis (no upfront cost unless mentioned)
- California City, CA––20 years, guarantee of 80% performance, seller owns renewable energy credits (RECs), initial price of 9.5¢ per kilowatt-hour (kWh) with a 1.5% per year escalator, assumption of 0.25% panel degradation.
- Minneapolis––20 years, 10.7¢ per kWh fixed, RECs belong to utility (which provided a grant with ratepayer money worth 65% of project cost), city may buy out at year 7 at 14% of initial cost.
- Lancaster, CA
- Power Authority agreement––25 year term, 9¢ per kWh, escalating at 1.5% annually, Power Authority makes a prepayment of (9¢ * 85% of expected energy generation in year 1 * 9% discount rate).
- Lancaster City Hall––15 years with extensions, 10¢ per kWh fixed price, purchase option at year 6 for $1.8 million, year 10 at $1.69 million, year 15 at fair market value. Termination value in year 1 = $5.37 million.
This article originally posted at ilsr.org. For timely updates, follow John Farrell on Twitter or get the Democratic Energy weekly update.
Rooftop Revolution: Past Reports
In 2012, ILSR published a pair of reports that projected, by 2021,10% of electricity in the U.S. could come from solar and at a lower price—without subsidies—than utility-provided electricity. In 2014 and 2015, Environment America’s Shining Cities reports examined how cities were catalysts for solar development.
By 2022, over 38 million homes and businesses could get solar power from their own rooftop, pay less for electricity, without any subsidies for solar. These two reports, published in 2012, outline the growth potential for local solar power and the coming rooftop revolution. Click to see more of our Rooftop Revolution resources.
 |
 |
![]()
![]()
![]()
![]()